
Dynatrace has long provided monitoring visibility into Nginx modules via the response time hotspots listing on each Nginx service page. Now you can access this hotspot data within the global CPU profiler where it is now correlated with Nginx CPU-consumption metrics.
To access Nginx CPU-consumption data
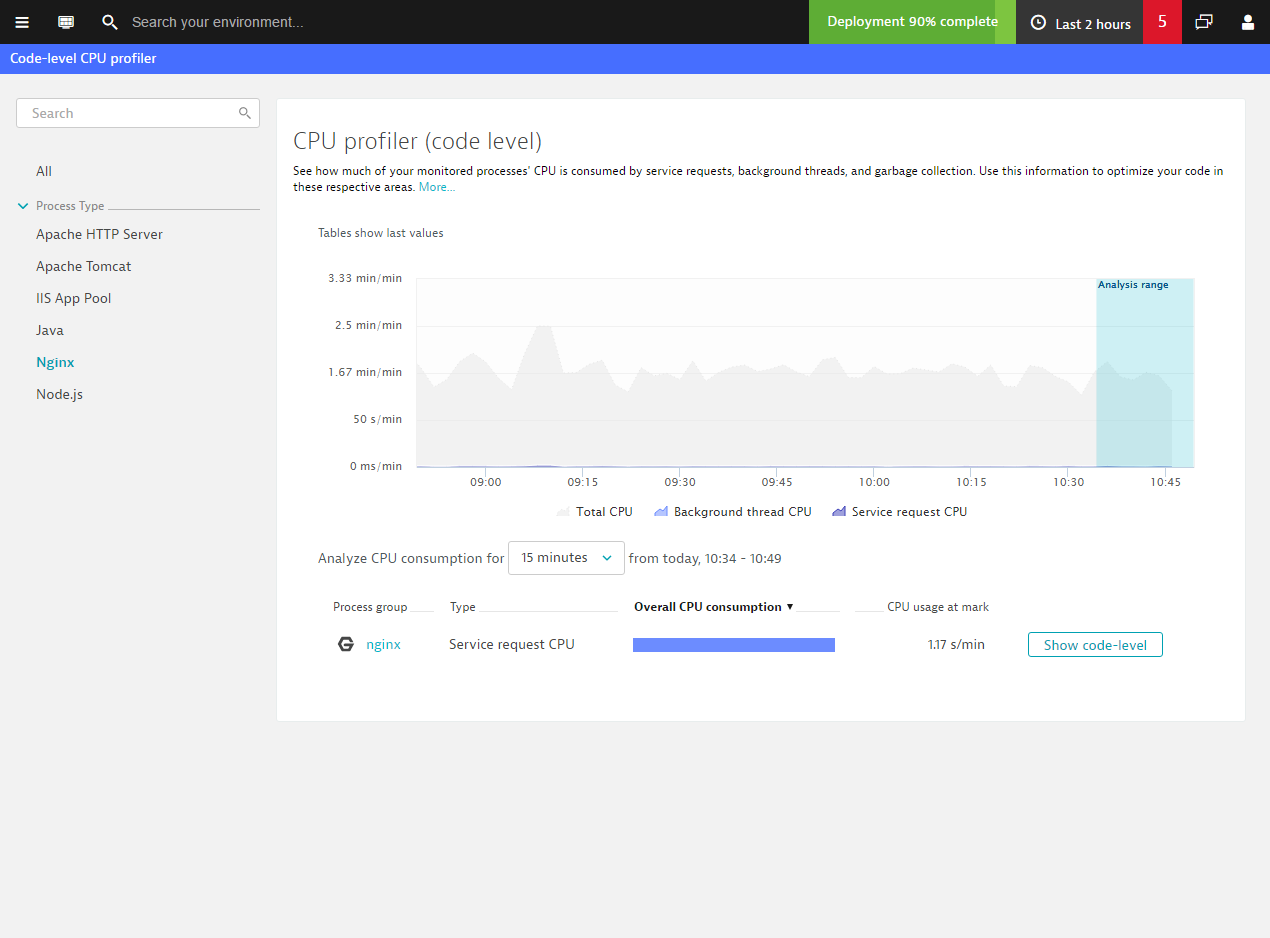
- Select CPU profiler (code level) from the menu.
- From the Process type list, select Nginx.
From here you can either analyze the entire process group at the code level (see example below)…
…or you can select a specific process group to analyze CPU consumption of the specific processes within that group (see example below).
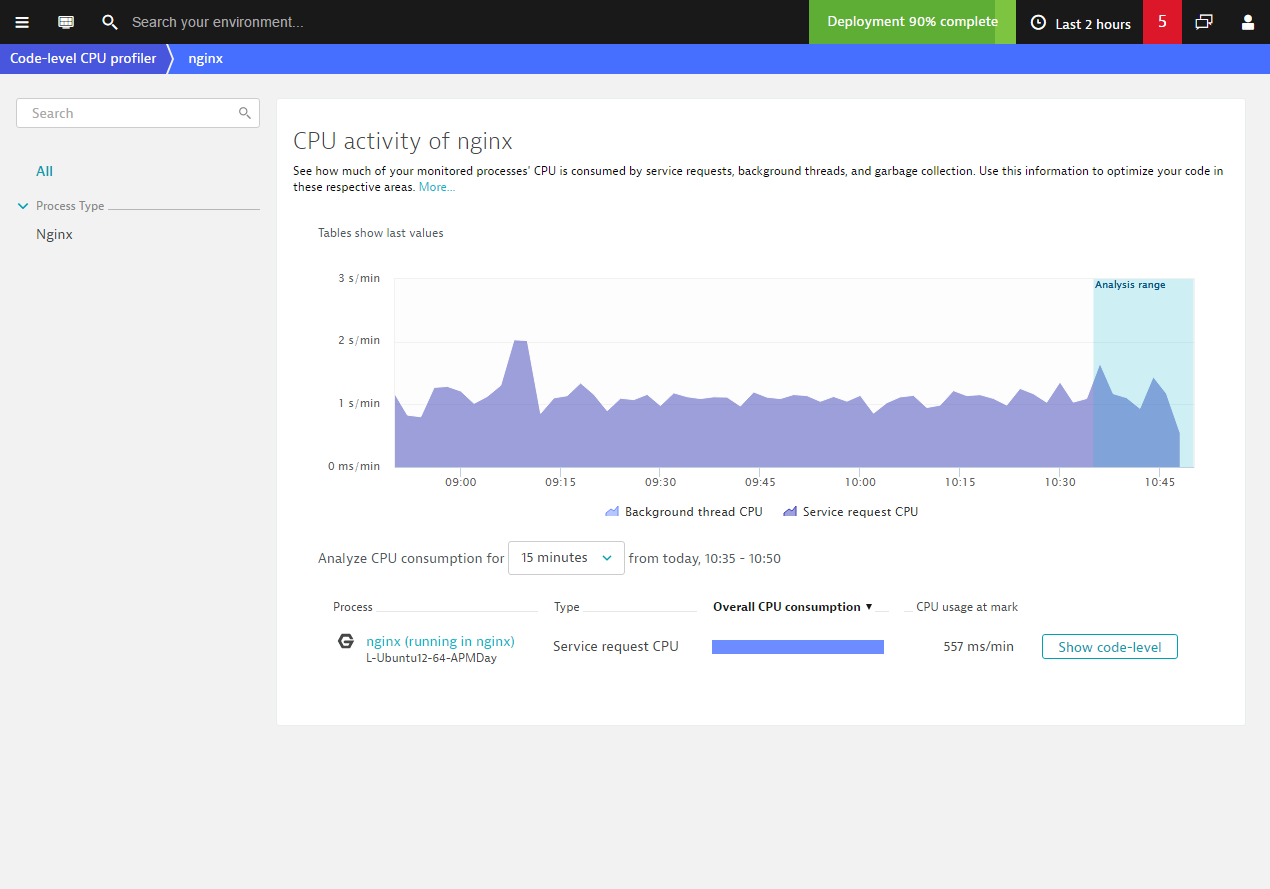
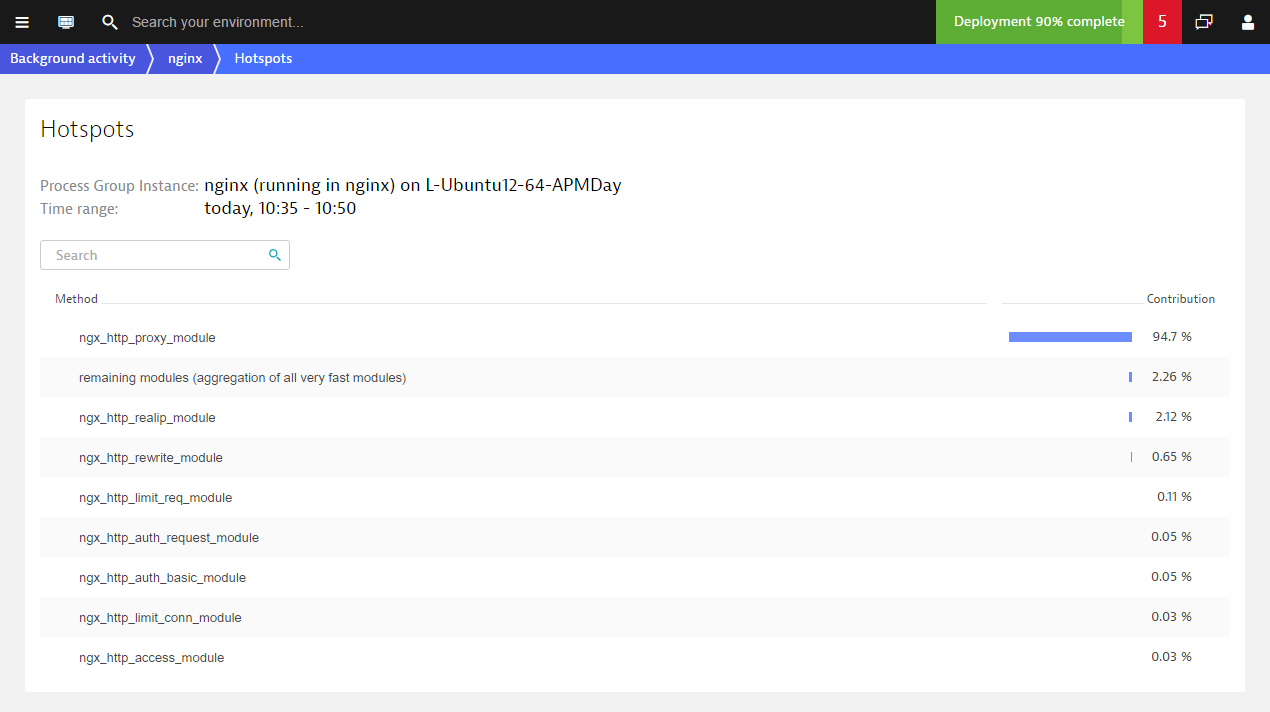
Click the Show code level button on the process group page (see above) to view the Nginx module breakdown. Note that, in contrast to other processes, this doesn’t necessarily represent CPU consumption, but rather time consumption within Nginx.
Visit our dedicated Nginx monitoring webpage to learn more about how Dynatrace supports Nginx.


Looking for answers?
Start a new discussion or ask for help in our Q&A forum.
Go to forum