
We’re proud to announce availability of Redis server monitoring. Redis server monitoring with Dynatrace provides insights into your distributed key-value caching system, helping you pinpoint server performance issues and identify potential bottlenecks.
Redis monitoring metrics
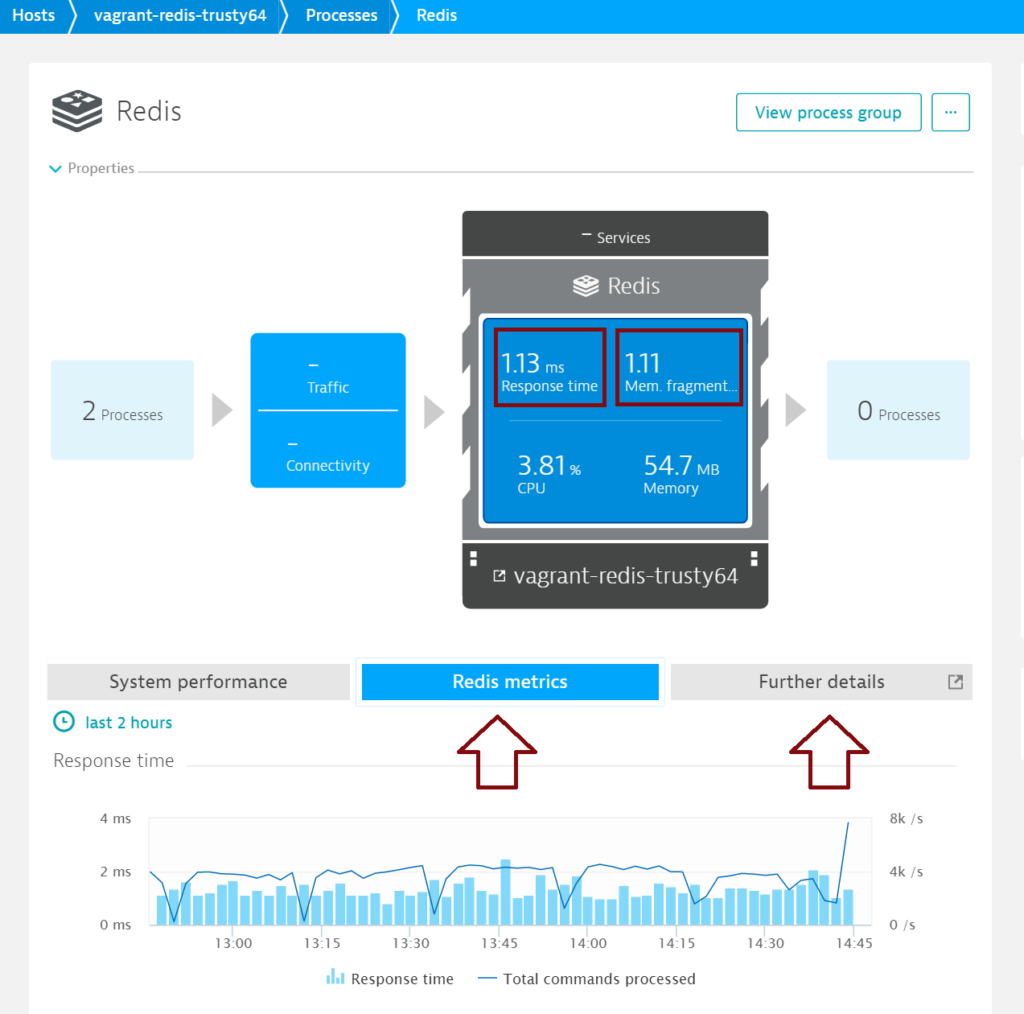
Valuable Redis metrics are displayed on each Redis process page within an intuitive infographic. Click the Redis metrics and Further details tabs to view deeper insights.
Key metrics
Response time
Time elapsed while Redis server responds to INFO requests. Redis typically responds within milliseconds.
Memory fragmentation
Memory fragmentation is the ratio of memory used by the operating system compared to the amount of memory allocated by Redis.
- A fragmentation ratio less than
1.0means that Redis requires more memory than is available on the system and so it has resorted to using swap memory resources. - A fragmentation ratio greater than
1.0indicates that fragmentation is taking place and the Redis instance is consuming more physical memory than has been requested. - A healthy Redis server Memory fragmentation ratio is slightly more than
1.0. A ratio greater than1.5indicates that excessive fragmentation is taking place. In such instances, you should restart Redis server to allow the operating system to recover the memory that has become unusable due to fragmentation.
The following metrics are captured for each Redis server instance.
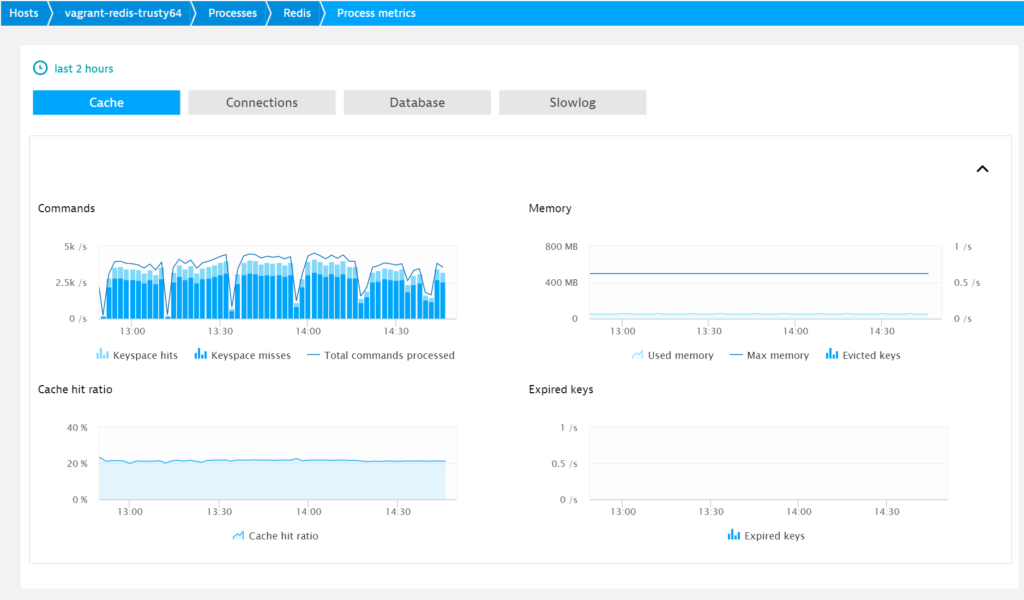
Standard Redis metrics
- Total commands processed
Number of commands processed by Redis per second. - Memory usage
Percentage of utilized Redis memory. This metric is only visible when the Redis maxmemory parameter is configured. - Connected
Number of client connections (excluding connections from replicas (previously referred to as “Redis slaves”). - Blocked
Number of blocked clients. - Rejected connections
Number of connections rejected because of the maxclients limit. By default, recent versions of Redis don’t close connections with clients, even when clients are idle for a long time—connections remain open indefinitely. You have the option of configuring a timeout, in which case client connections can be closed when they remain idle for a certain period of time. Timeouts are configured in the file redis.conf. - Total connections received
Number of connections accepted by the server. - Connected replicas
Number of connected replicas. This metric is visible for the master and those replicas that are connected to other replicas. - Keyspace hits
Number of successful key lookups in the main dictionary. - Max memory
Maximum memory allowed in Redis cache. You can adjust this parameter as required. - Evicted keys
Number of keys removed from cache to free up memory for new items. An increasing number of evicted keys can be a symptom of high memory usage. - Cache hit ratio
Percent of successful key lookups in the main dictionary. - Expired keys
Number of key expiration events. Expiration events are triggered when keys are deleted by Redis. Please be aware that expiration events are not triggered once a key’s TTL (Time to Live) status falls to zero. - # of keys
Number of keys in the selected database. - Expires
Number of keys that have the TTL parameter. - Average TTL
Estimated average TTL of keys on the server. - Slow queries
Number of queries in the Redis Slow Log. The Redis Slow Log records queries that have exceeded their specified execution times. Execution times don’t include I/O operations (for example, talking with the client, sending replies, and so forth). Execution times include only the time required to execute command queries. The Slow Log can be configured with two parameters:- slowlog-log-slower-than tells Redis what the execution time is (in microseconds) that, once exceeded, results in the query being recorded in the Slow Log.
- slowlog-max-len is the maximum number of queries that are retained in the Slow Log.
Prerequisites:
- Redis Server 2.8+ (Redis Sentinel is not yet supported)
- Linux OS
- Redis must listen on
localhost. Binding betweenlocalhostand Redis port is required (until August 2016). - If you have multiple Redis instances on a single host, all instances must have the same password (or no password).
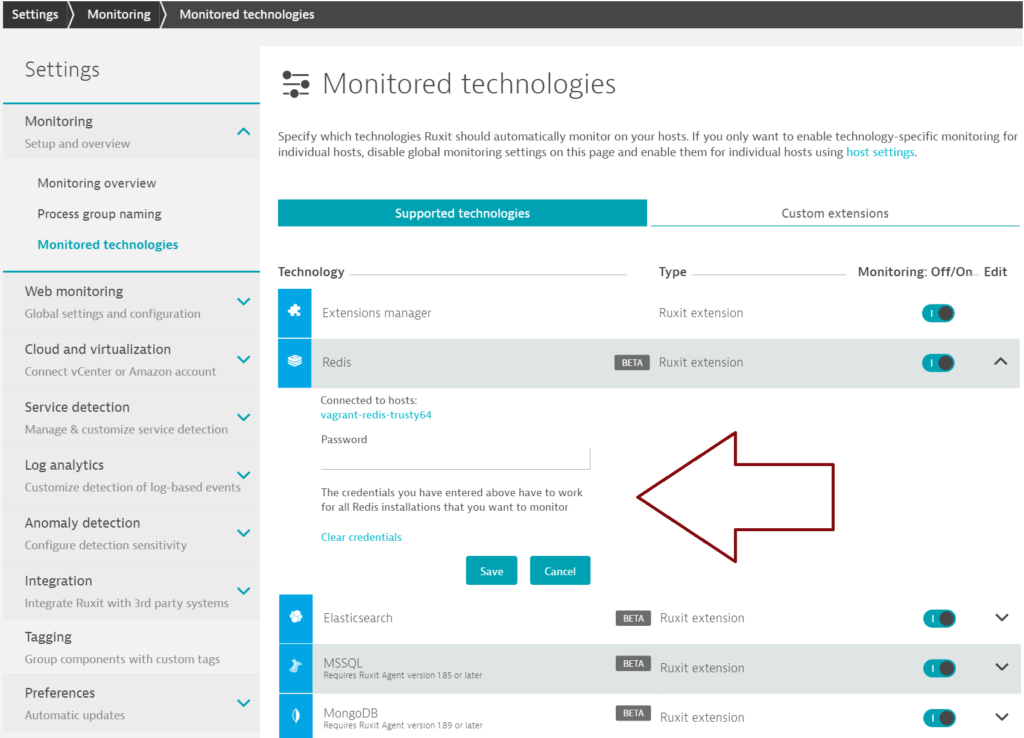
Enable Redis monitoring globally
With Redis monitoring enabled globally, Dynatrace automatically collects Redis metrics whenever a new host running Redis is detected in your environment.
- Open the Dynatrace menu and select Settings > Monitoring > Monitored technologies.
- Set the Redis switch to On.
- Define a password (or leave the field blank if the password has not been set on the Redis server.
Note: If you have multiple Redis instances on a single host, all instances must have the same password (or no password).
Enable Redis monitoring for individual hosts
Dynatrace provides the option of enabling Redis monitoring for specific hosts rather than globally.
- Disable the global Redis monitoring setting (if enabled, as explained above).
- Open the Dynatrace menu and select Hosts.
- Select the host you want to configure.
- Click Edit.
- Set the Redis switch to On.
As this is a beta version of Redis monitoring, your feedback is most welcome. Let us know how the new Redis plugin works for you. Just add a comment below or post your feedback to Dynatrace Community. Please note that Redis Sentinel is not yet supported, but it will be supported in a future version.


Looking for answers?
Start a new discussion or ask for help in our Q&A forum.
Go to forum