
We’re excited to announce the release of Dynatrace Elasticsearch monitoring. Elasticsearch server monitoring provides a high-level overview of all Elasticsearch components within each monitored cluster in your environment.
Elasticsearch health metrics tell you everything you need to know about the health of your monitored clusters. So, when a problem occurs, it’s easy to see which nodes are affected. And it’s easy to drill down into the metrics of individual nodes to find the root cause of problems and potential bottlenecks.
To view Elasticsearch monitoring insights
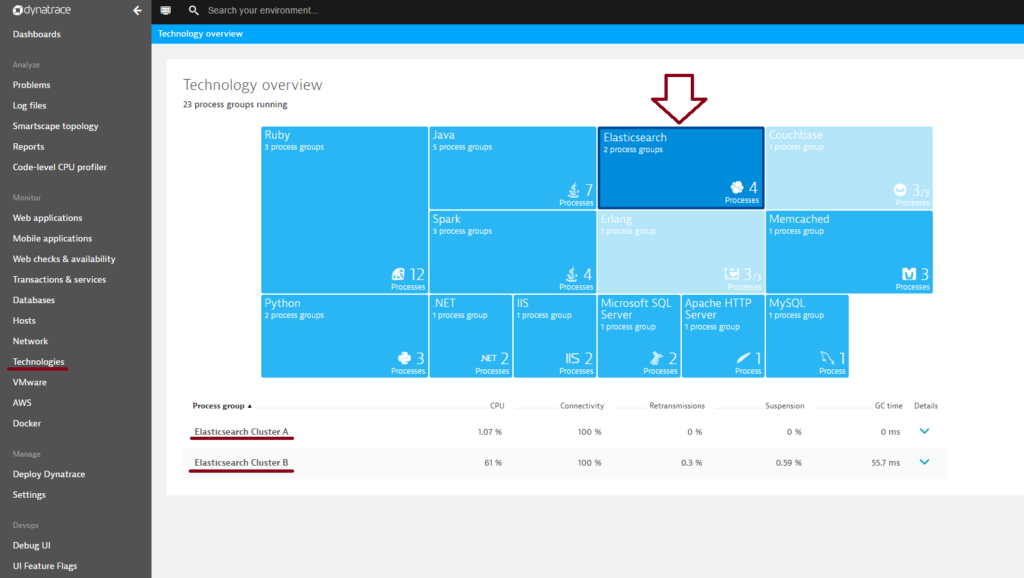
- Click Technologies in the navigation menu.
- Click the Elasticsearch tile.
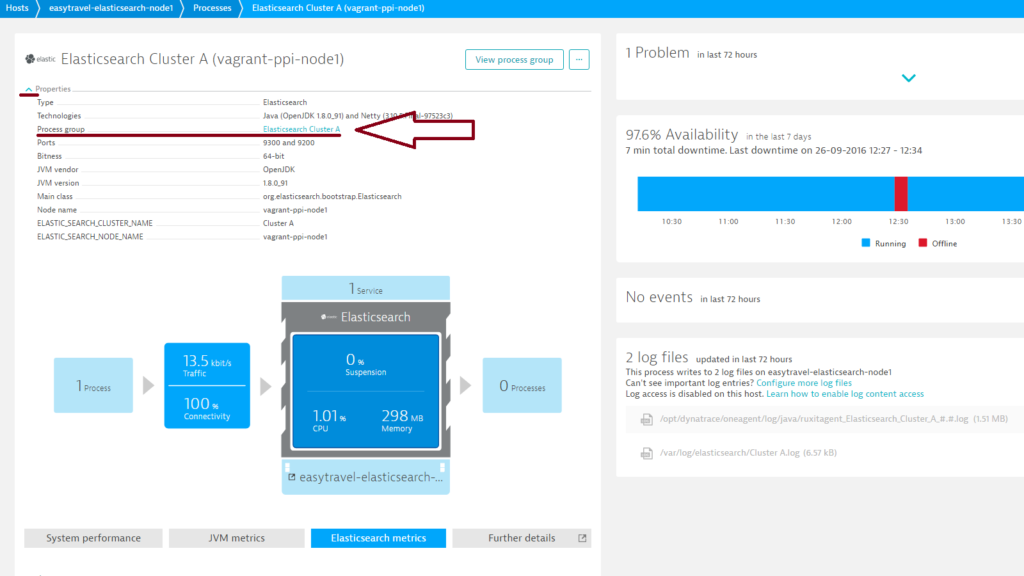
Individual Elasticsearch clusters are represented as process groups. All detected Elasticsearch Process groups are listed at the bottom of the page.
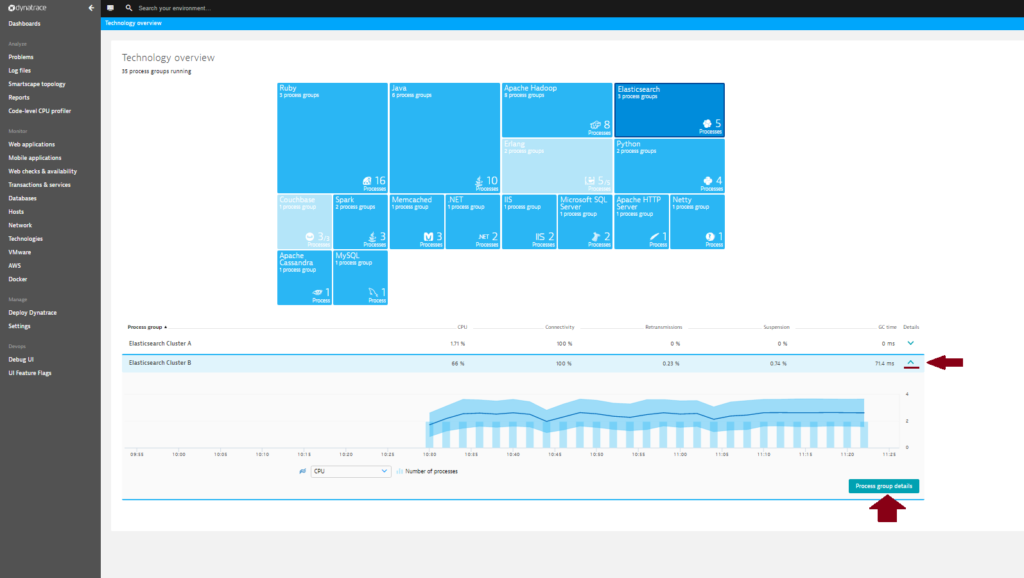
- To view cluster metrics, expand the Details section of the process group you want to analyze.
- Click the Process group details button.
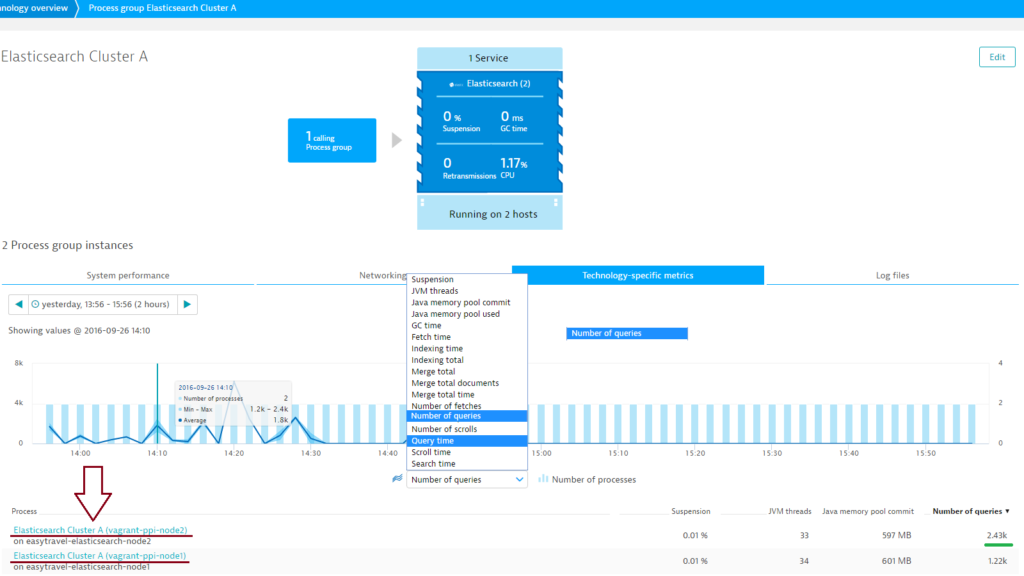
- On the Process group details page, select the Technology-specific metrics tab to view relevant cluster charts and metrics. Elasticsearch cluster overview pages (i.e., “process group” overview pages) provide an overview of individual cluster health. From here it’s easy to identify problematic nodes. Just select a node metric from the metric droplist, select a relevant time frame on the timeline, and compare the values of all nodes in a sortable table.

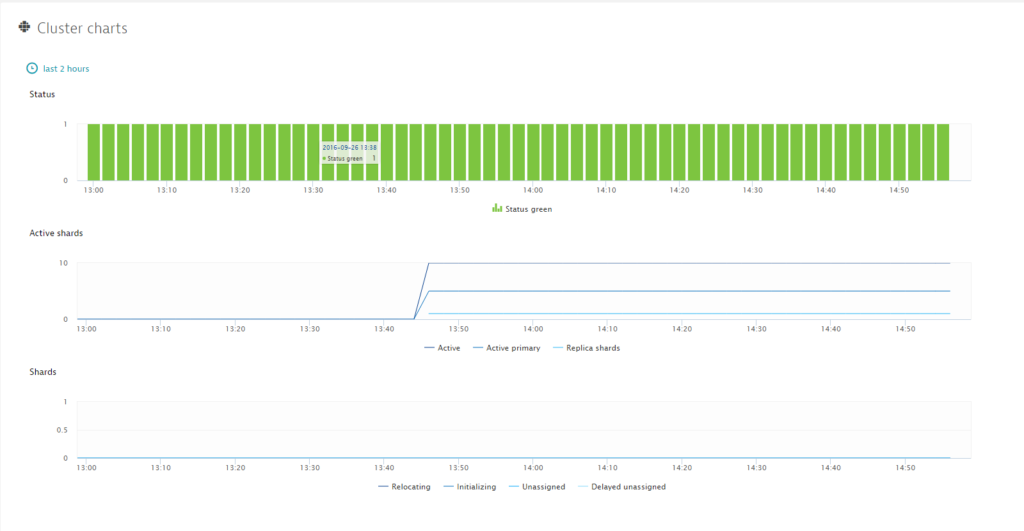
- Further down the page, you’ll find a number of cluster-specific charts.
Elasticsearch cluster monitoring metrics
Status
Green
All primary and replica shards are allocated. Your cluster is 100% operational.
Yellow
All primary shards are allocated, but at least one replica is missing. No data is missing, so search results will still be complete. However, availability is compromised to a degree. If more shards disappear, you may lose data. Think of yellow as a warning that should prompt investigation.
Red
At least one primary shard (and all of its replicas) is missing. This means that you are missing data. Searches will return partial results, and indexing a missing shard will return an exception.
Active shards
Indicates the number of primary shards in your cluster. This is an aggregate total across all indices.
Active primary shards
The aggregate total of all shards across all indices, including replica shards.
Replica shards
The aggregate total of replica shards. If the node holding a primary shard dies, a replica will be promoted to the role of primary shard.
Relocating shards
Shows the number of shards that are currently moving from one node to another. This number is often zero, but can increase when Elasticsearch decides that a cluster isn’t properly balanced, a new node is added, or a node is taken down.
Initializing shards
The count of freshly created shards. When you first create an index, all shards briefly reside in the initializing state. This is typically a transient event; shards shouldn’t linger in the initializing state too long. You may also see initializing shards when a node is first restarted. As shards are loaded from disk, they begin in the initializing state.
Unassigned shards
The shards that exist in the cluster state, but can’t be found in the cluster itself. A common source of unassigned shards is unassigned replicas. For example, an index with five shards and one replica will have five unassigned replicas in a single-node cluster. Unassigned shards are also present when a cluster is in red status (because primary shards are missing).
Delayed unassigned shards
The number of shards whose allocation has been delayed.
Number of nodes
Number of nodes.
Number of data nodes
Number of data nodes. Data nodes hold data and perform data-related operations, such as CRUD, search, and aggregations.
Indices
Number of indexes.
Deleted documents
Number of deleted documents. Deleted documents are items that were deleted, but continue to occupy space.
Documents
Number of documents.
Evictions
Number of query cache evictions. The query cache implements an LRU eviction policy that evicts the oldest data when the cache becomes full to make way for new data.
Size
The size of the query cache.
Count
Number of items in the query cache.
Field data evictions
Number of field data cache evictions. A high number of evictions means that your cache/hit ratio is low. This results in excessive disk reading and has a negative impact on performance.
Field data size
The size of the field data cache. A large field data cache suggests that Elasticsearch has not been correctly implemented.
Segment count
Number of segments. In Elasticsearch, each shard is broken up internally into “segments.” The number of segments should not grow endlessly as they should be “merged” into bigger segments over time. This metric can indicate a problem if the number continues to increase.
Elasticsearch node monitoring
To access valuable Elasticsearch node metrics
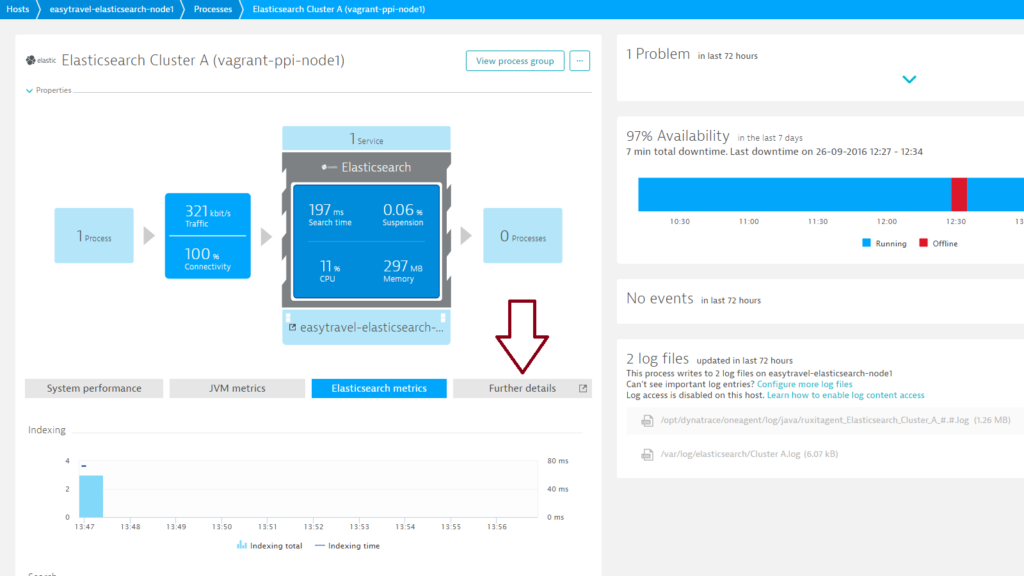
- Select a node from the Process list on the Process group details page.
- On the Elasticsearch Process page, select the Elasticsearch metrics tab.
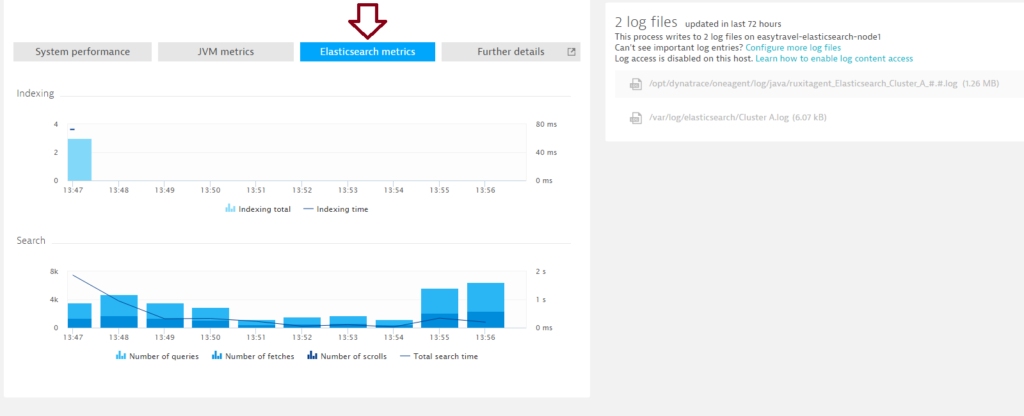 The Indexing chart shows the effectiveness of all indexing operations.
The Search time chart serves as an indicator of how efficient your search operations are. More operations in a shorter time interval indicates improved performance - To jump back to the cluster level, expand the Properties section of the Elasticsearch Processes page and select the cluster.
Node metrics
Indexing total
Shows the number of docs that have been indexed. This number doesn’t decrease when docs are deleted. This number is incremented each time an internal index operation occurs, including updates.
Indexing time
Amount of time spent on indexing.
Number of queries
Number of query operations.
Number of fetches
Number of fetch operations.
Number of scrolls
Number of scroll operations.
Total search time
Aggregation of time spent on queries, fetches, and scrolls operations.
Additional Elasticsearch node monitoring metrics
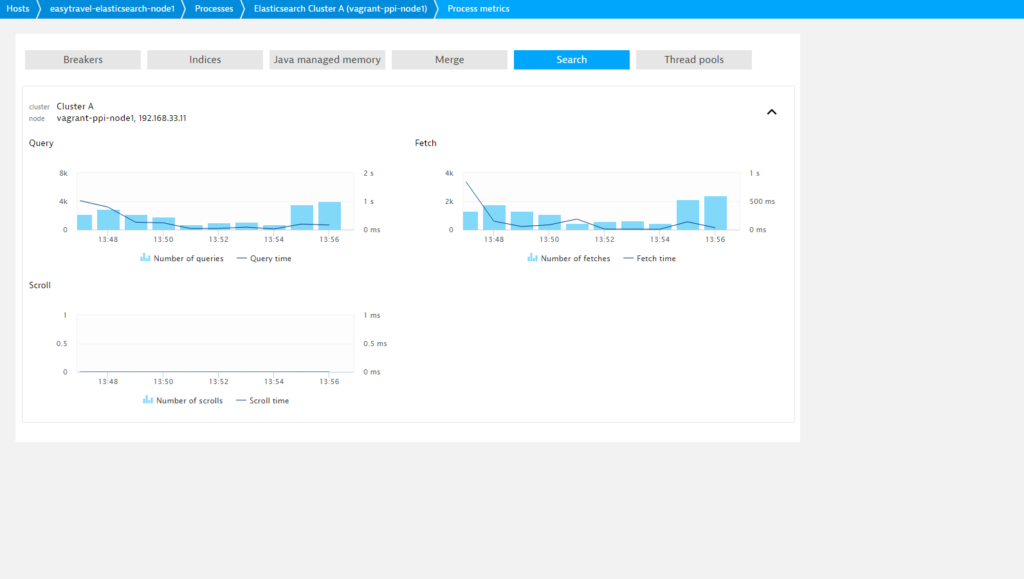
Many more Elasticsearch monitoring metrics are available from individual Process pages. Select the Further details tab for additional monitoring insights.
On the Further details tab you’ll find six additional sections.
Breakers
Circuit breakers are used to prevent operations from causing OutOfMemoryError errors. Each breaker specifies a limit for how much memory it can use. If the estimated query size is larger than the limit, the circuit breaker is tripped, the query is aborted, and an exception is returned. This happens before data is loaded, which means that an OutOfMemoryException won’t be triggered.
Indices
Shows additional in-depth information around Elasticsearch indices. Of particular interest is the Translog chart, which shows if Elasticsearch is keeping up with the data coming in by flushing it out to the indices on disk.
Java managed memory
Java heap usage and garbage collection.
Merge
Can show the root cause of problems when a system is under too much load and merging can’t keep up.
Search
Shows additional in-depth information around Elasticsearch search operations, contains detailed performance metrics for queries, fetches, and scrolls.
Thread pools
Shows details about how much load the system is currently processing. Enables you to see if you can increase the rate of queries or the amount of writes. Also enables you to see if there’s a bottleneck in one of the thread pools.
A full description of all Elasticsearch stats is available at www.elastic.co.
Most metrics are taken directly from Elasticsearch stats and presented as is, with no additional computation.
Prerequisites
• Elasticsearch 2.3+
• Linux OS or Windows
• Dynatrace OneAgent 101+
• OneAgent must have to be installed on all Elasticsearch nodes
Enable Elasticsearch monitoring globally
With Elasticsearch monitoring enabled globally, Dynatrace automatically collects Elasticsearch metrics whenever a new host running Elasticsearch is detected in your environment. All Elasticsearch instances must have the same password (or no password).
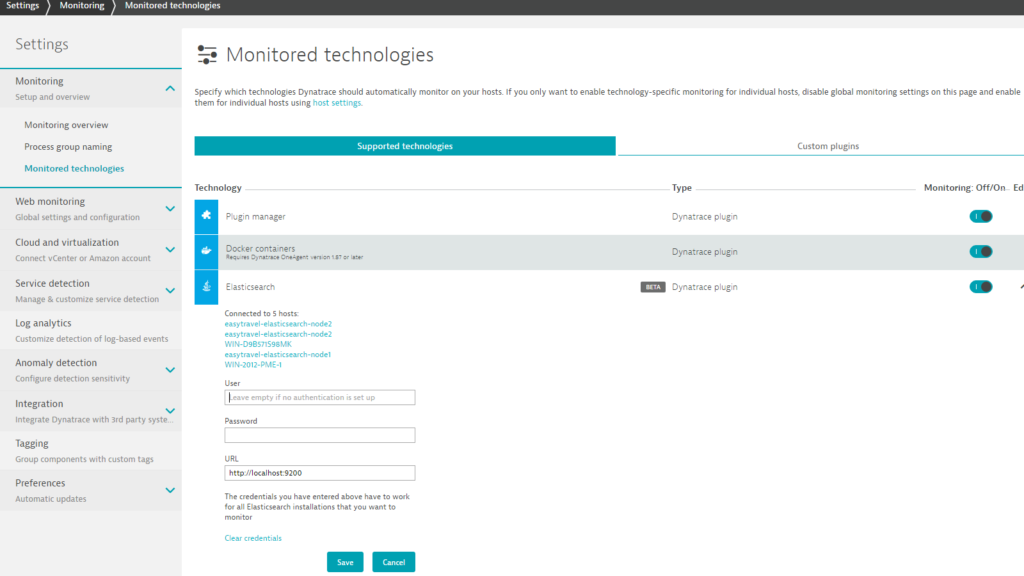
- Go to Settings > Monitoring > Monitored technologies.
- Set the Elasticsearch switch to On.
- Define a user (or leave the field blank if authentication has not been set up on the Elasticsearch server.)
- Define a password and URL. (the default is: “http://localhost:9200)
Enable Elasticsearch monitoring for individual hosts
Dynatrace provides the option of enabling Elasticsearch monitoring for specific hosts rather than globally
- If global Elasticsearch monitoring is currently enabled, disable it by going to Settings > Monitoring > Monitored technologies and setting the Elasticsearch switch to Off.
- Select Hosts in the navigation menu.
- Select the host you want to configure.
- Click Edit.
- Set the Elasticsearch switch to On.
Visit our dedicated webpage about Elasticsearch monitoring to learn more about how Dynatrace supports Elasticsearch. Please note that the beta version of Dynatrace Elasticsearch monitoring doesn’t support events on the cluster level. We’ll introduce this functionality in a future release.
Your feedback about Dynatrace Elasticsearch monitoring is most welcome! Let us know what you think of the new Elasticsearch plugin by adding a comment below. Or post your questions and feedback to Dynatrace Community.


Looking for answers?
Start a new discussion or ask for help in our Q&A forum.
Go to forum