
We’re excited to announce the beta release of Dynatrace Couchbase monitoring! Couchbase server monitoring provides a high-level overview of all Couchbase components in your cluster.
To view Couchbase monitoring insights
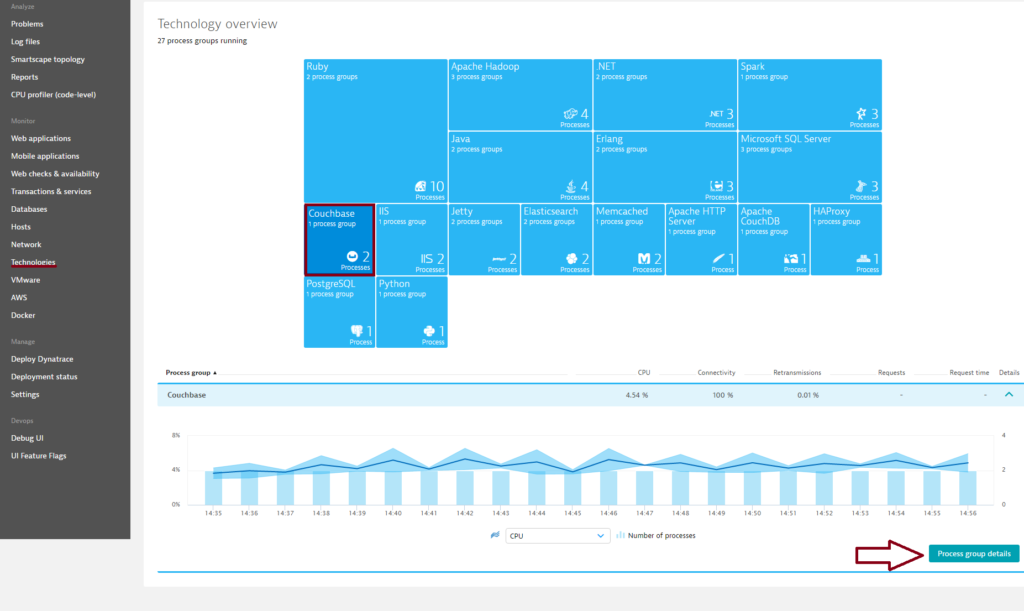
- From the navigation menu, click Technologies.
- Click the Couchbase tile.
Note that the monitoring of multiple Couchbase clusters isn’t supported in this beta release. All nodes are presented under a single process group. - To view cluster metrics, expand the Details section of the Couchbase process group.
- Click the Process group details button.
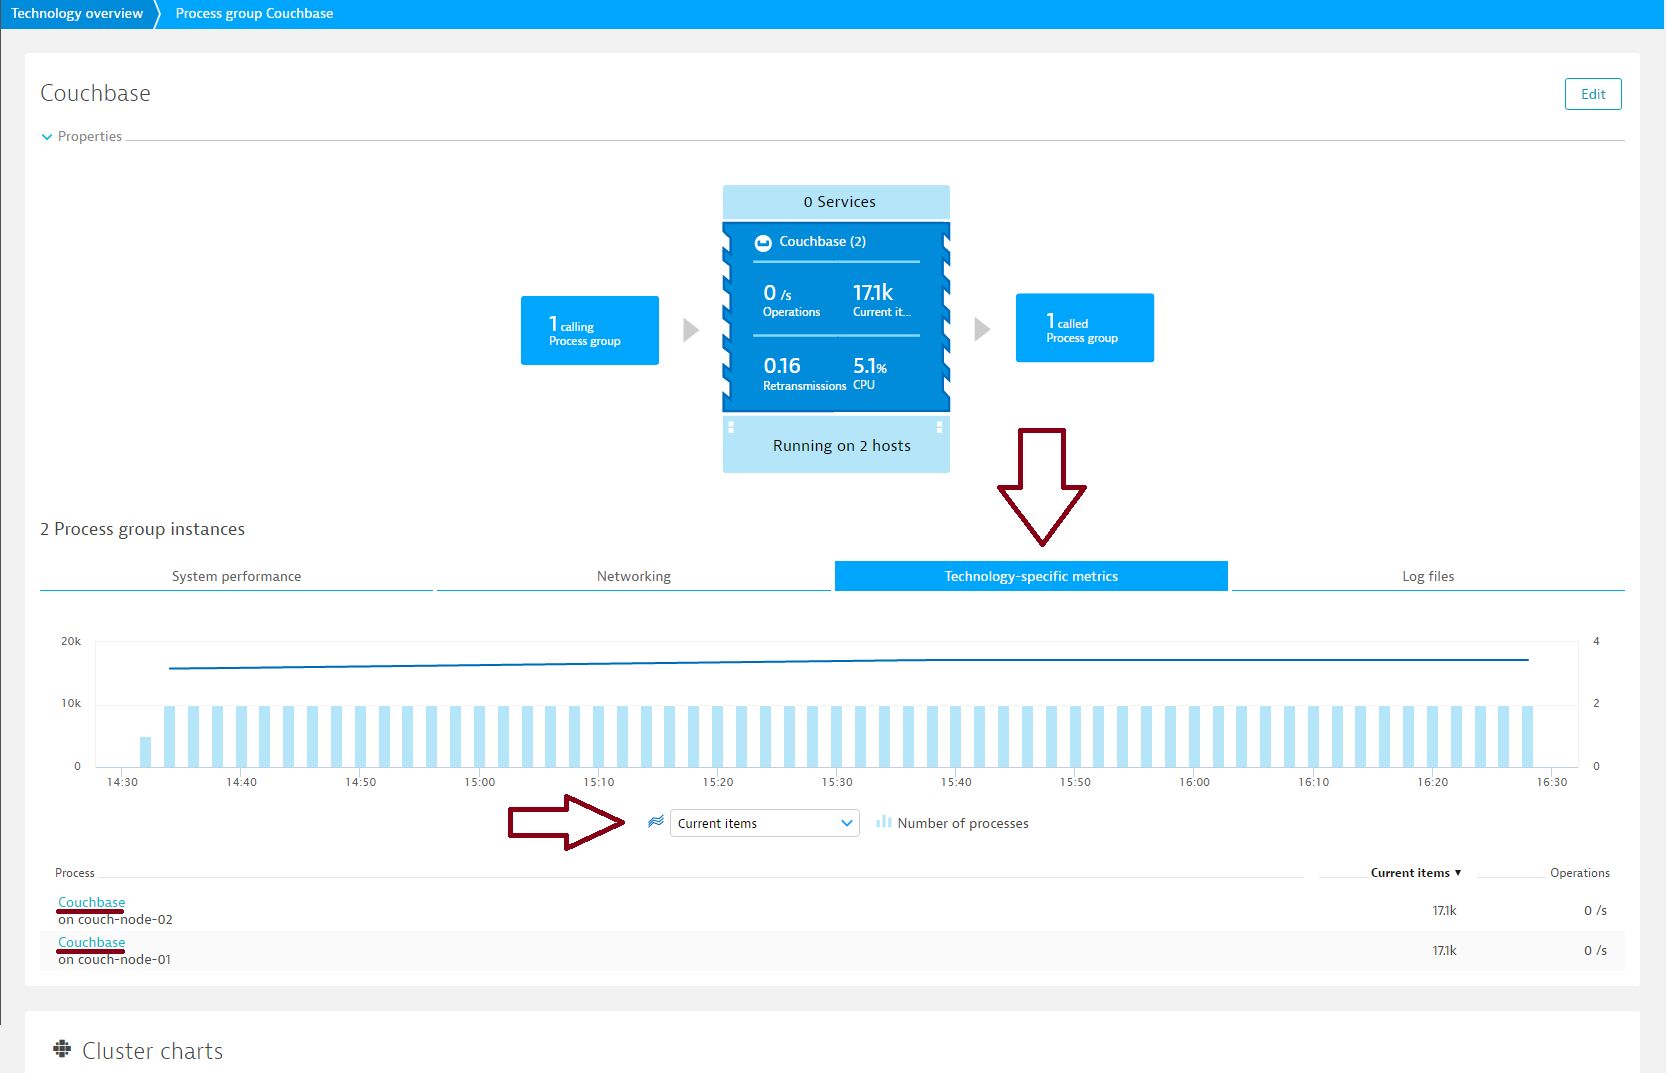
- On the Process group details page, select the Technology-specific metrics tab to view relevant cluster charts and metrics. Couchbase cluster overview pages (i.e., Process group overview pages) provide an overview of Couchbase cluster health and performance. This page is also helpful for identifying problematic nodes. Just select a relevant time interval for the timeline, select a node metric from the metric drop list, and compare the values of all nodes in the sortable table.
- Further down the page, you’ll find a number of other cluster-specific charts.
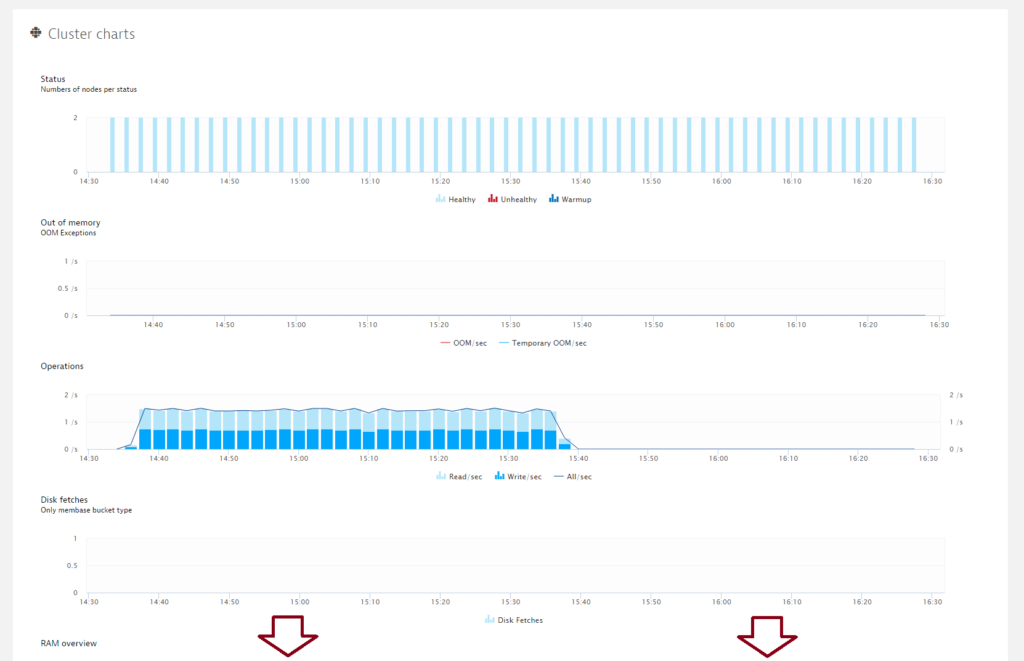


Couchbase cluster charts
Status
Number of nodes per status (healthy, unhealthy, warmup)
Out of memory
Number of OOM and temporary OOM per sec
Operations
Number of operations
Disk fetches
Disk fetches for memcached buckets
RAM overview
Overview of cluster memory
Disk overview
Overview of cluster disk usage
Swap usage
Cluster swap usage
Cache miss rate
Percent of requests not found in the cache
Number of ejected items
Number of times that item values were ejected from memory to disk
Current items
Number of documents stored on the cluster
Buckets
Numbers of buckets per type
Couchbase node monitoring
To access valuable Couchbase node metrics:
- From you Couchbase Process group details page (see below), select a node from the Process list at the bottom of the page.

- Click the Couchbase metrics tab.
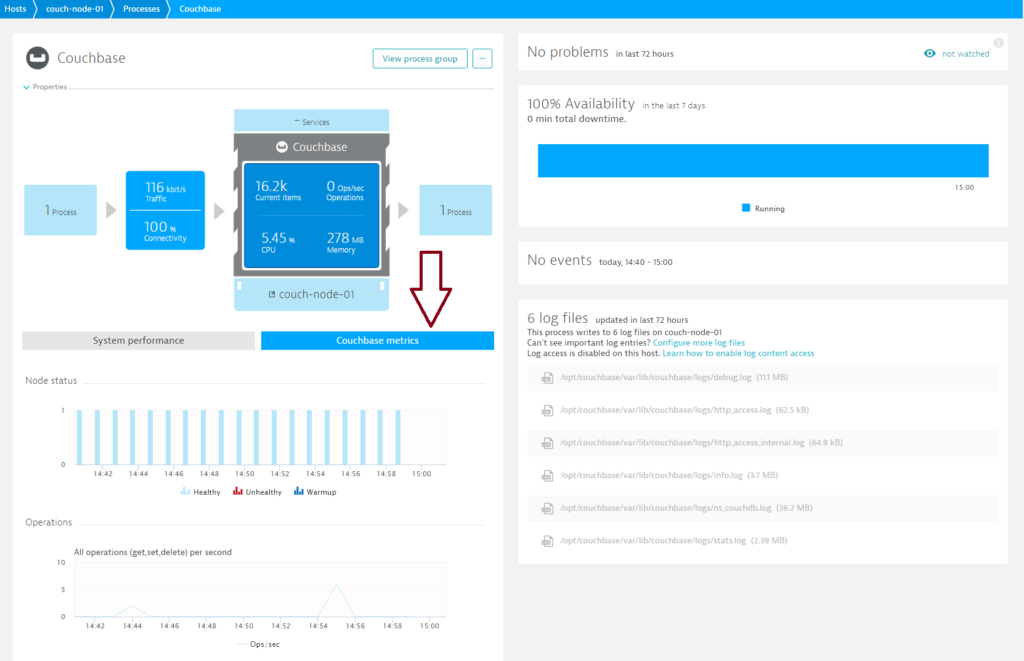 Charts available on the node level include Node status, Operations, Disk fetches, RAM usage, Swap usage, and Current items.
Prerequisites
- Linux OS or Windows
- Couchbase version 4.3+
Enable Couchbase monitoring globally
With Couchbase monitoring enabled globally, Dynatrace automatically collects Couchbase metrics whenever a new host running Couchbase is detected in your environment.
All Couchbase instances must have the same username and password.
- Go to Settings > Monitoring > Monitored technologies.
- Set the Couchbase switch to On.
- Click the ^ button to expand the details of the Couchbase integration.
- Define a User.
- Define a Password and Port (the default port is
8091). - Click Save.
Enable Couchbase monitoring for individual hosts
Dynatrace provides the option of enabling Couchbase monitoring for specific hosts rather than globally.
- If global Couchbase monitoring is currently enabled, disable it by going to Settings > Monitoring > Monitored technologies and setting the Couchbase switch to Off.
- Select Hosts from the navigation menu.
- Select the host you want to configure.
- Click Edit.
- Set the Couchbase switch to On.
Want to read more?
Visit our dedicated Couchbase monitoring webpage to learn more about database monitoring and how Dynatrace supports Couchbase.
Have feedback?
Your feedback about Dynatrace Couchbase monitoring is most welcome! Let us know what you think of the new Couchbase plugin by adding a comment below. Or post your questions and feedback to Dynatrace Community.


Looking for answers?
Start a new discussion or ask for help in our Q&A forum.
Go to forum