
As the great Danish physicist, Niels Bohr, famously said, “Prediction is very difficult, especially about the future.” While predicting the future with any certainty remains a challenge for most things in life, Dynatrace has been working hard to make it possible for you to predict your environment’s future service load. By collecting information and metrics related to past load, user traffic, and performance, it’s now possible to make short-term predictions about the service load and traffic that your environment will encounter in the future! Such service load forecasts enable you to design an implement intelligent microservices provisioning modules within third-party cluster-management systems.
Effective management of highly dynamic microservices clusters is one of the foundations of modern system architecture. Today’s microservices management systems are capable of quickly scaling microservices up and down to adapt to current demand. Compared to traditional service architectures, microservices scaling operations are performed within minutes instead of hours. What’s crucial here is to know when a microservices scaling operation is necessary in order to efficiently handle a changing load situation. This includes scaling up during high load situations to guarantee adequate service performance and scaling down during periods of low load to save on resource expenses.
Dynatrace full-stack monitoring provides the necessary load information about each of your microservices, in real time. For provisioning operations that are based on current load, the Dynatrace API can be used to retrieve load metrics from each individual service.
We’ve further enhanced the Dynatrace Timeseries API to not only provide the current load of each service but also to provide you with a forecast as to where service load will likely be in the near future. Predicted loads not only contain predicted values for each timespan, they also provide ranges that include minimum and maximum values. These ranges reflect the statistical uncertainty of load prediction.
Please note that each prediction is heavily dependent on the quality and stability of load patterns observed by Dynatrace in the past. In general, load prediction is based on an exponential smoothing approach that takes daily and weekly load patterns into account, with more recent observations carrying more weight than older observations. The Dynatrace API restricts prediction calls to a minimum resolution of 30-minute time spans. Finer-grained time spans are typically of little value within longer-term forecasts due to evolving environmental conditions.
Timeseries API example with load prediction
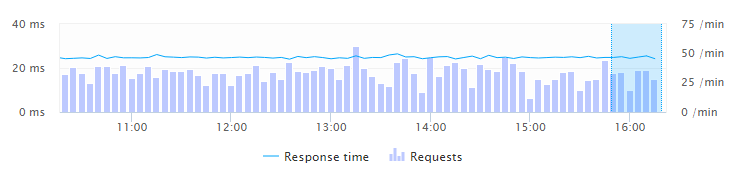
To try out the new load-prediction capabilities, use the Dynatrace Timeseries API to fetch the number of requests/minute over the last two hours received by a stable service. Here’s an example:
https://.live.dynatrace.com/api/v1/timeseries/?relativeTime=2hours&Api-Token=&aggregationType=COUNT&entity=×eriesId=com.ruxit.builtin:service.requestsperminThe current load retrieved for this example service is shown below.
To predict the service load for this service, restrict the time period of the API request to 30min and add the parameter predict=true at the end. The resulting JSON contains a timestamp, the prediction, and the min/max values, as shown below.
https://.live.dynatrace.com/api/v1/timeseries/?relativeTime=30mins&Api-Token=&aggregationType=COUNT&entity=×eriesId=com.ruxit.builtin:service.requestspermin&predict=true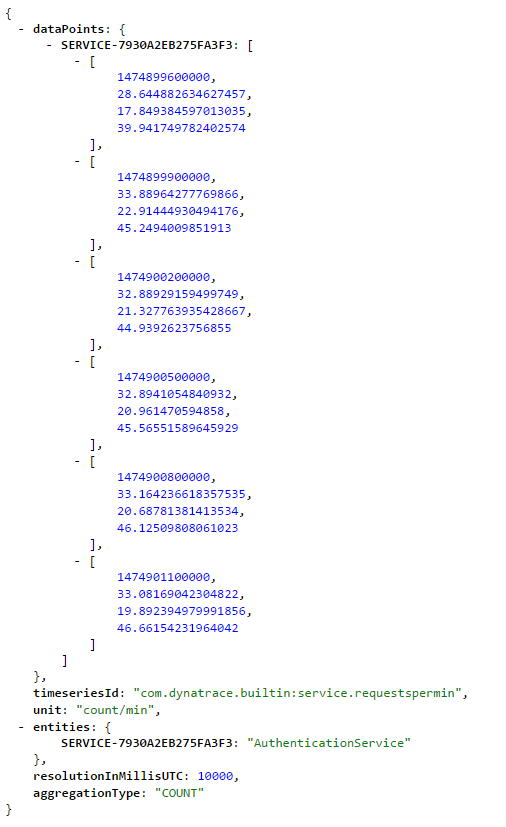
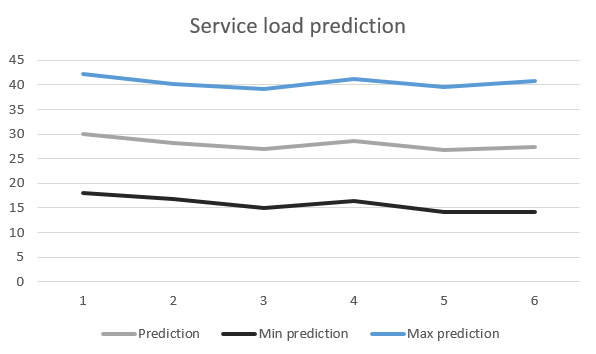
This API requests returns a predicted range of about 28-33 requests per minute, while the full range of possible values runs from 17 to 46 requests per minute, as shown below.
To learn all the details of our new prediction API, see Prediction and forecast-based anomaly detection in Dynatrace Help.


Looking for answers?
Start a new discussion or ask for help in our Q&A forum.
Go to forum