
Processes crash for a multitude of reasons and it’s often difficult to understand the root causes that contribute to such crashes. This is why Dynatrace is proud to announce the availability of crash analysis for processes.
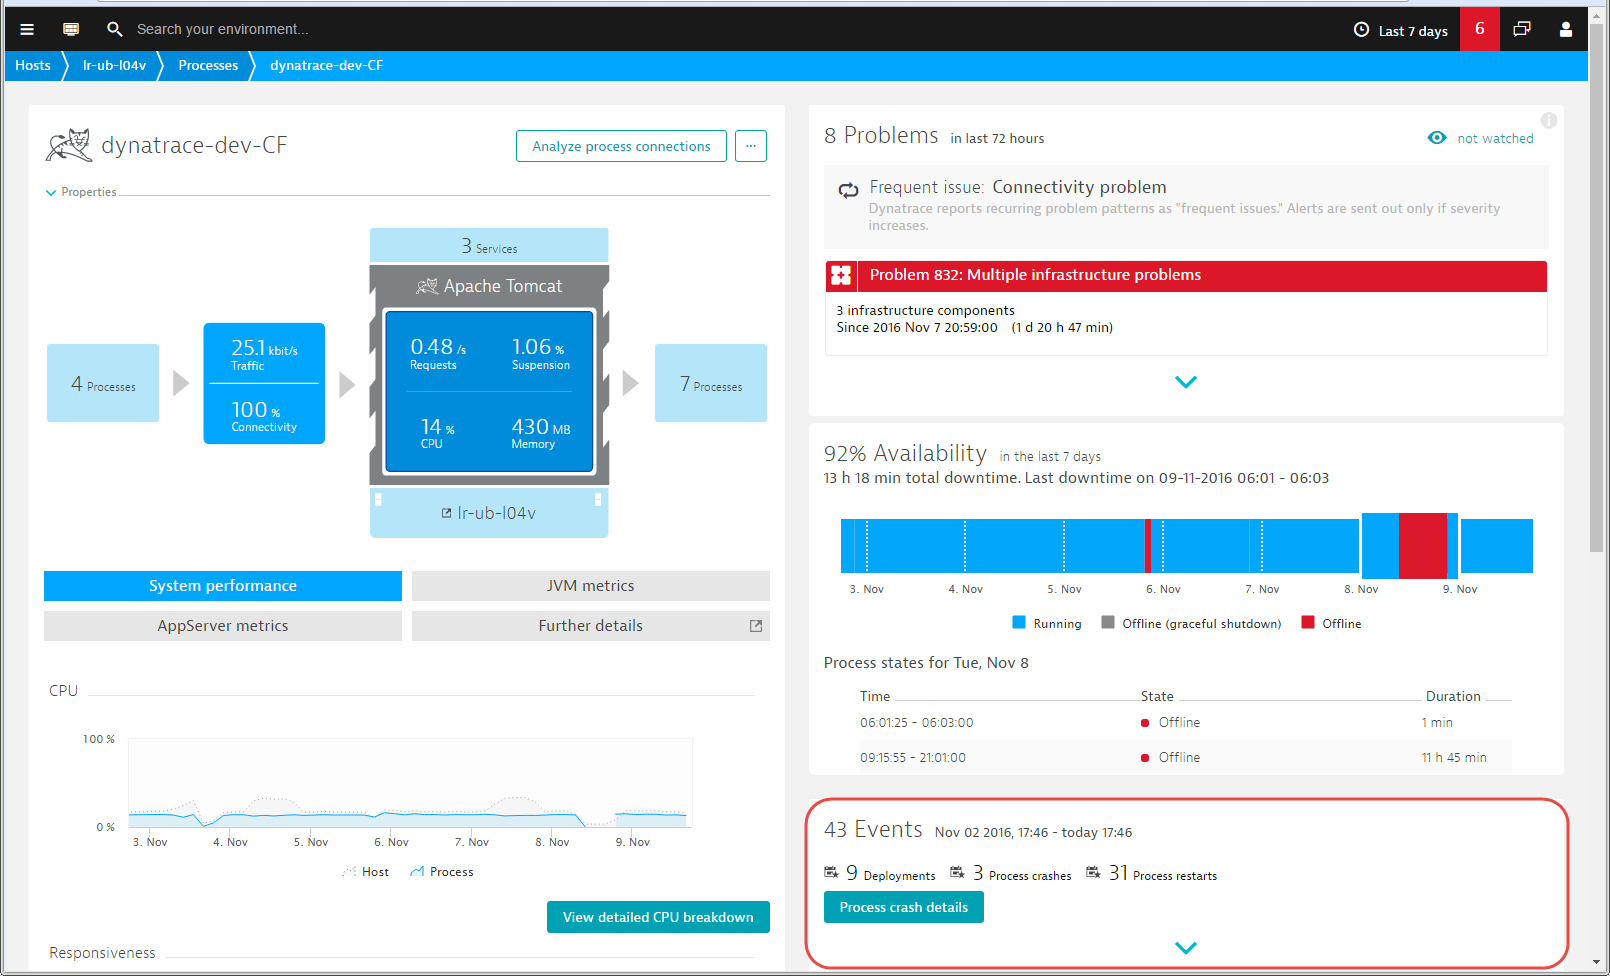
As before, when a monitored process crashes, you’ll see a Process crash entry in the Events section of each affected Process and Host page. The example process below has some availability problems (shown in red on the timeline). By selecting the affected timeframe in the timeline, the Events section shows you the number of process crashes that occurred during that timeframe (3 crashes in this example). This functionality isn’t new. What’s new is the Process crash details button.
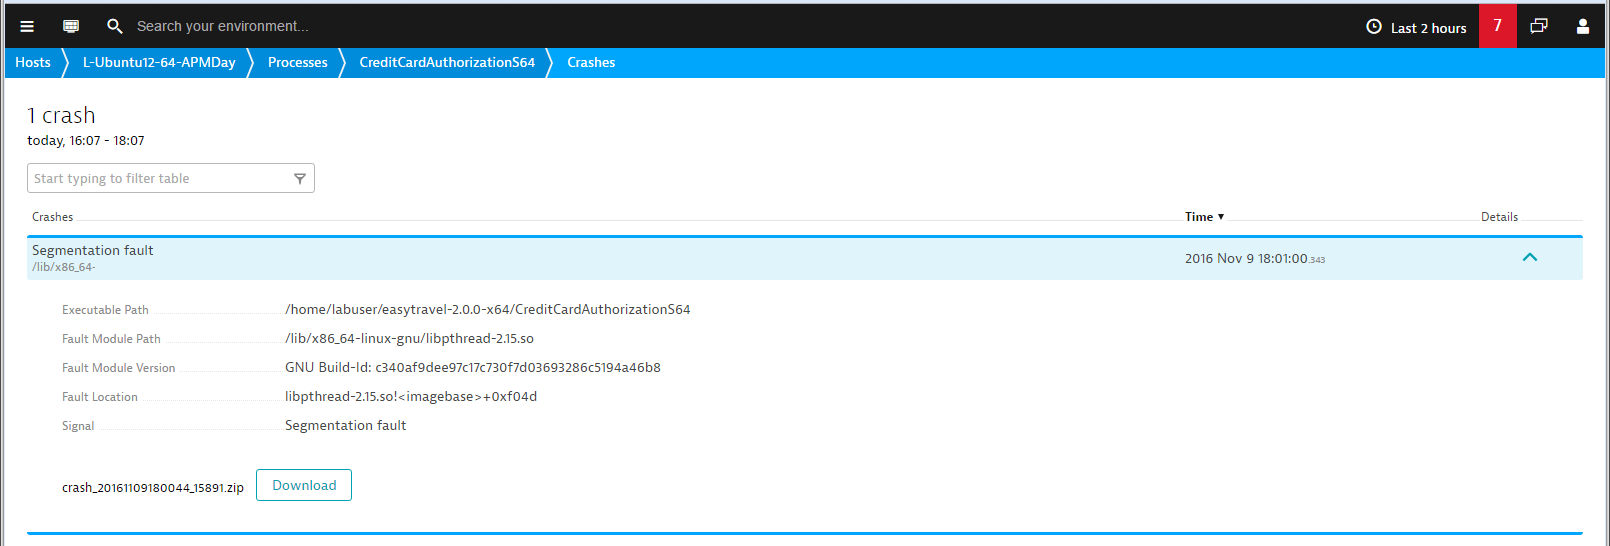
Click the Process crash details button to view a detailed list of the crashes that occurred during the selected timeframe. Here you’ll find all details related to why each process crashed.
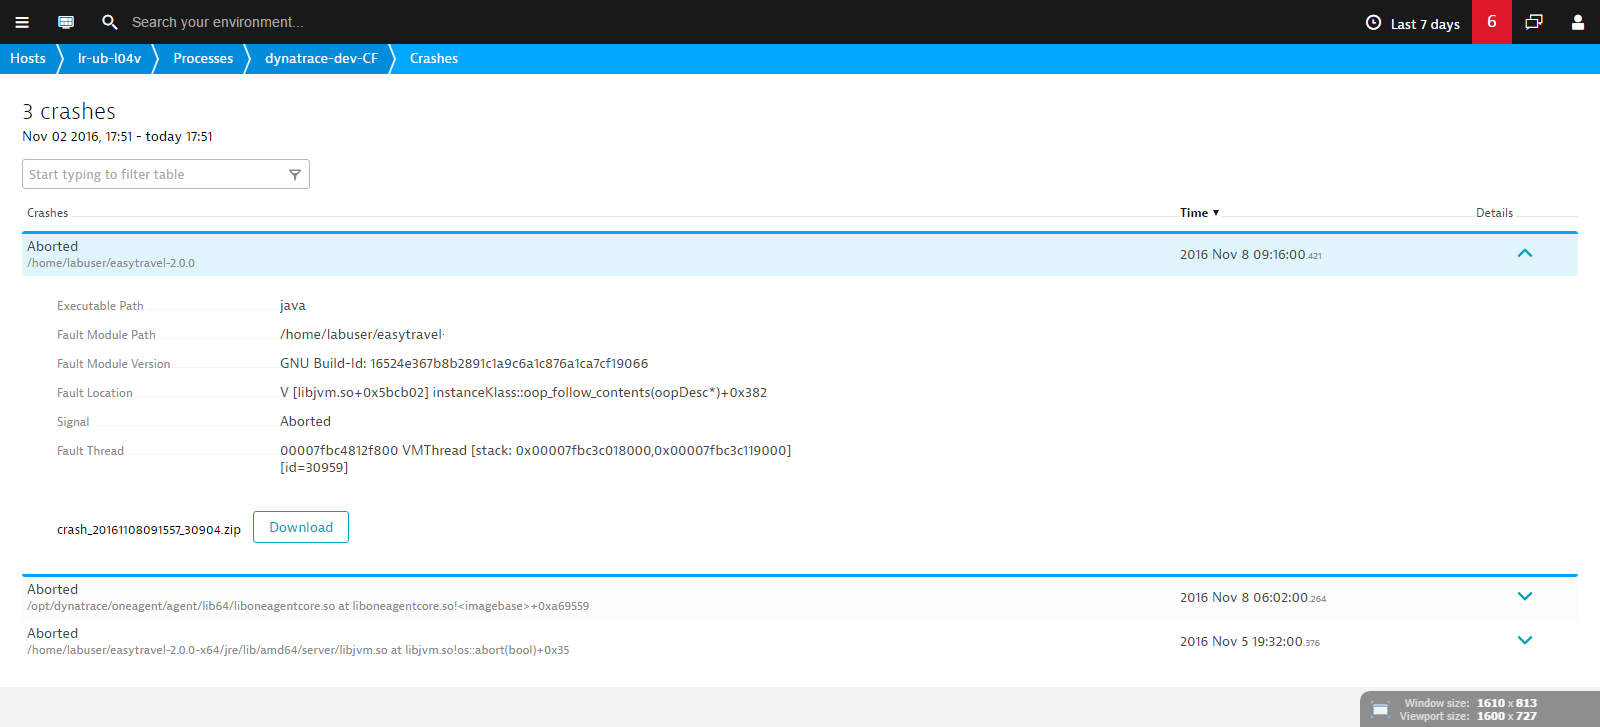
Provided crash details include the signal that killed the process (e.g., Segmentation fault or Abort), the execution stack frame that crashed, and more. Available details vary based on the type of crash, be it a native core dump, Java core dump, or an abnormal program exit due to exceptions.
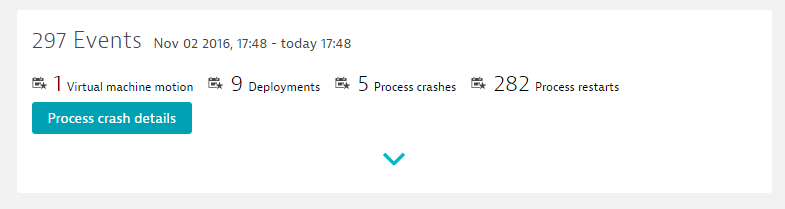
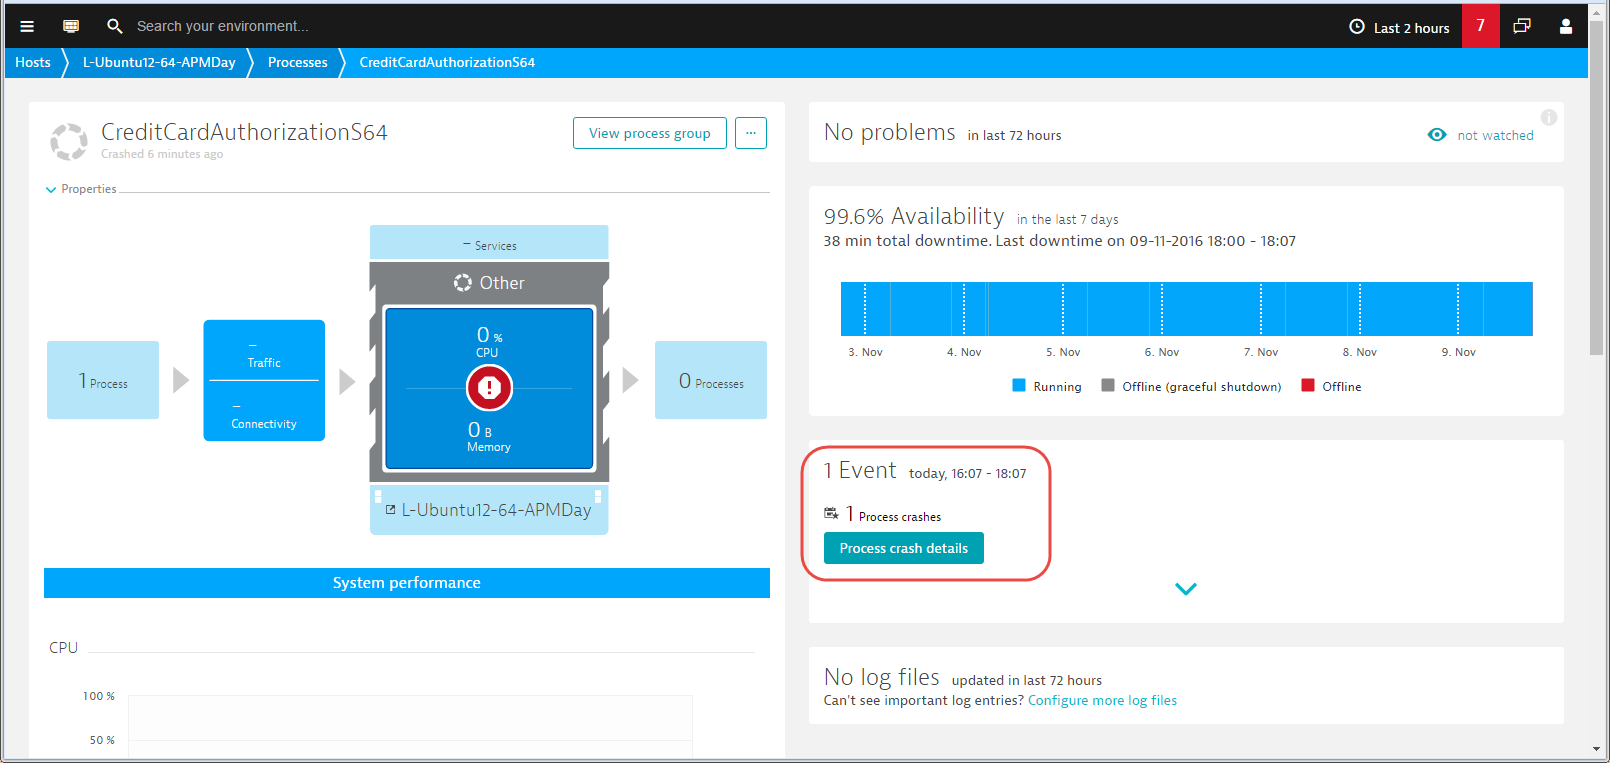
Note that this functionality works for all processes on each monitored host (see example below).
Analyze additional crash artifacts
Crash details often include a Download button that provides access to additional crash artifacts, such as hs_err_pid files for Java crashes, text files that provide analysis of Linux and Windows core dumps, or files containing the .NET, Java, or Node.js exceptions that were potentially responsible for the crashes.
For example, the Segmentation fault crash report above resulted in a core dump. Dynatrace OneAgent analyzed the core dump automatically and then produced the following report as a log artifact:
dumpproc version 1.108.0.20161025-115919, installer version 1.108.0.20161025-121046

2016-11-09 18:00:44: Application 'CreditCardAutho', inner pid '15891', outer pid '0', signal: 'Segmentation fault' (11)

process group ID: 0x441b2cb89962033d

process group instance ID: 0xfe58bab23100f42c

process group Name: easytravel-*-x*
threadCount: 1
thread: 0 - stack range: 0x7ffeda572000-0x7ffeda594000, size: 136 kB
0x00007ffeda592be0 0x00007f4de477604d libpthread-2.15.so!<imagebase>+0xf04d
0x00007ffeda592bf0 0x00000000004038d8 CreditCardAuthorizationS64!main+0x1b8
0x00007ffeda592c60 0x00007f4de41c676d libc-2.15.so!__libc_start_main+0xed
0x00007ffeda592d20 0x000000000040329a CreditCardAuthorizationS64!<imagebase>+0x329a
mapped files:
0000000000400000-000000000041e000 0 /home/labuser/easytravel-2.0.0-x64/CreditCardAuthorizationS64 (MD5: da5992daf5ba3b76c633c853c7da5e87)
000000000051d000-000000000051e000 1d /home/labuser/easytravel-2.0.0-x64/CreditCardAuthorizationS64 (MD5: da5992daf5ba3b76c633c853c7da5e87)
00007f4de41a5000-00007f4de4359000 0 /lib/x86_64-linux-gnu/libc-2.15.so (GNU Build-Id: aa64a66ac46bff200848c0a0694011bd0140ab4e)
00007f4de4359000-00007f4de4558000 1b4 /lib/x86_64-linux-gnu/libc-2.15.so (GNU Build-Id: aa64a66ac46bff200848c0a0694011bd0140ab4e)
00007f4de4558000-00007f4de455c000 1b3 /lib/x86_64-linux-gnu/libc-2.15.so (GNU Build-Id: aa64a66ac46bff200848c0a0694011bd0140ab4e)
00007f4de455c000-00007f4de455e000 1b7 /lib/x86_64-linux-gnu/libc-2.15.so (GNU Build-Id: aa64a66ac46bff200848c0a0694011bd0140ab4e)
00007f4de4563000-00007f4de4565000 0 /lib/x86_64-linux-gnu/libdl-2.15.so (GNU Build-Id: d181af551dbbc43e9d55913d532635fde18e7c4e)
00007f4de4565000-00007f4de4765000 2 /lib/x86_64-linux-gnu/libdl-2.15.so (GNU Build-Id: d181af551dbbc43e9d55913d532635fde18e7c4e)
00007f4de4765000-00007f4de4766000 2 /lib/x86_64-linux-gnu/libdl-2.15.so (GNU Build-Id: d181af551dbbc43e9d55913d532635fde18e7c4e)
00007f4de4766000-00007f4de4767000 3 /lib/x86_64-linux-gnu/libdl-2.15.so (GNU Build-Id: d181af551dbbc43e9d55913d532635fde18e7c4e)
00007f4de4767000-00007f4de477f000 0 /lib/x86_64-linux-gnu/libpthread-2.15.so (GNU Build-Id: c340af9dee97c17c730f7d03693286c5194a46b8)
00007f4de477f000-00007f4de497e000 18 /lib/x86_64-linux-gnu/libpthread-2.15.so (GNU Build-Id: c340af9dee97c17c730f7d03693286c5194a46b8)
00007f4de497e000-00007f4de497f000 17 /lib/x86_64-linux-gnu/libpthread-2.15.so (GNU Build-Id: c340af9dee97c17c730f7d03693286c5194a46b8)
00007f4de497f000-00007f4de4980000 18 /lib/x86_64-linux-gnu/libpthread-2.15.so (GNU Build-Id: c340af9dee97c17c730f7d03693286c5194a46b8)
00007f4de4984000-00007f4de4a02000 0 /lib/x86_64-linux-gnu/liboneagentproc.so (1.108.0.20161025-115919)
00007f4de4a02000-00007f4de4c01000 7e /lib/x86_64-linux-gnu/liboneagentproc.so (1.108.0.20161025-115919)
00007f4de4c01000-00007f4de4c03000 7d /lib/x86_64-linux-gnu/liboneagentproc.so (1.108.0.20161025-115919)
00007f4de4c03000-00007f4de4c05000 7f /lib/x86_64-linux-gnu/liboneagentproc.so (1.108.0.20161025-115919)
00007f4de4cc0000-00007f4de4ce2000 0 /lib/x86_64-linux-gnu/ld-2.15.so (GNU Build-Id: e25ad1a11ccf57e734116b8ec9c69f643dca9f18)
00007f4de4ee2000-00007f4de4ee3000 22 /lib/x86_64-linux-gnu/ld-2.15.so (GNU Build-Id: e25ad1a11ccf57e734116b8ec9c69f643dca9f18)
00007f4de4ee3000-00007f4de4ee5000 23 /lib/x86_64-linux-gnu/ld-2.15.so (GNU Build-Id: e25ad1a11ccf57e734116b8ec9c69f643dca9f18)
Protect sensitive user data
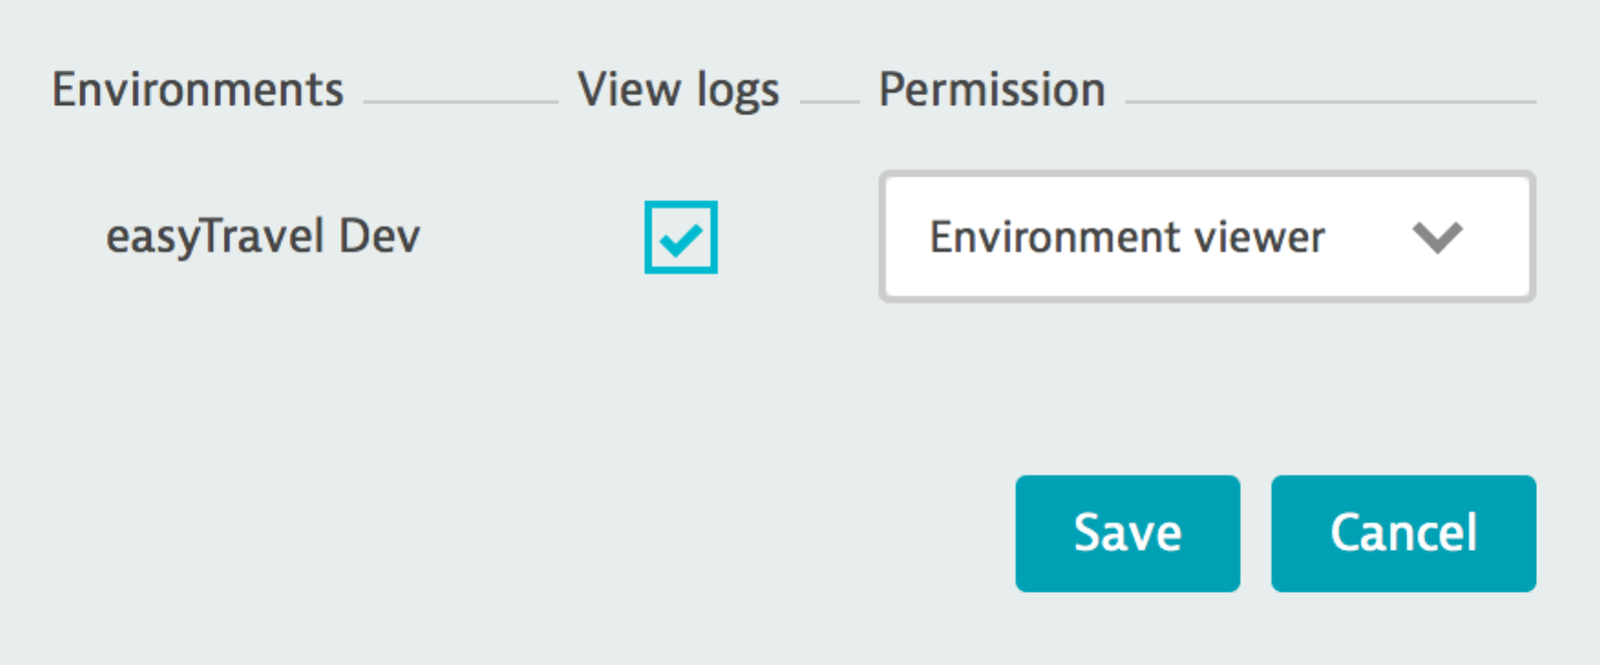
Crash reports may contain sensitive personal information that should not be viewed by all users. For this reason, your Dynatrace administrator must enable the View logs account-security option in your user profile before you can view sensitive data. This option is disabled by default for all non-admin users and must be explicitly enabled before you can access log contents.
Windows error reporting
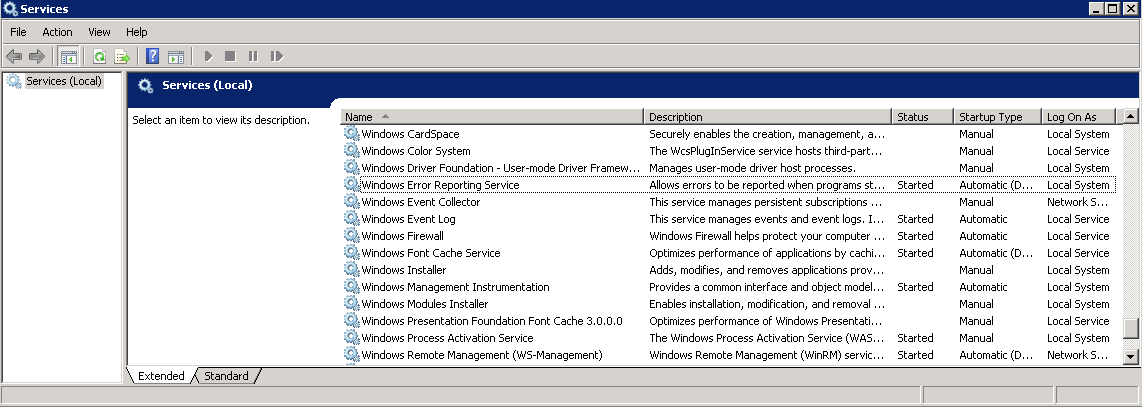
In order for a generic Windows process crash (core dump) to be visible to Dynatrace, the crash must be detected by Windows Error Reporting. For this reason, the Windows Error Reporting service must be enabled.
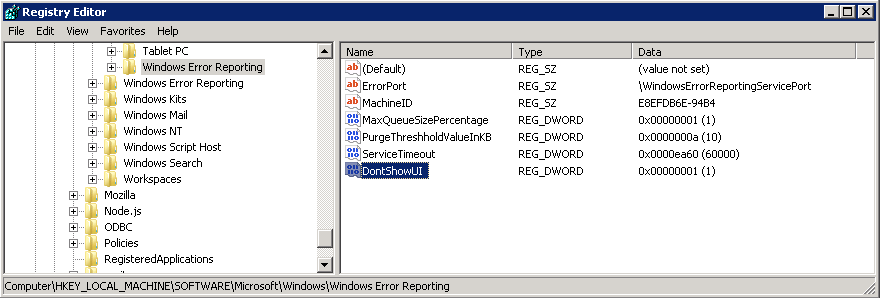
When a crash occurs on Windows, a dialog appears, asking if you want to debug or close the crashed application. This is not desirable for headless systems. You can disable this dialog by adding a value to the registry, as shown below:
[HKEY_LOCAL_MACHINE\SOFTWARE\Microsoft\Windows\Windows Error Reporting]
"DontShowUI"=dword:00000001
You can learn about other valuable settings related to Windows Error Reporting by visiting Microsoft documentation.


Looking for answers?
Start a new discussion or ask for help in our Q&A forum.
Go to forum