
Dynatrace has long provided the ability to detect distributed services (for details, see How does Dynatrace detect and name services?). To date, Dynatrace has represented distributed services as services that are hosted by multiple processes. Dynatrace now enables you to analyze the load distribution, response time spreads, and failure rates of each individual service instance.
To view service instances
- Open the Dynatrace menu and select Transactions & services.
- On the Services page, select a distributed service.
- On the service page, click the Details button.
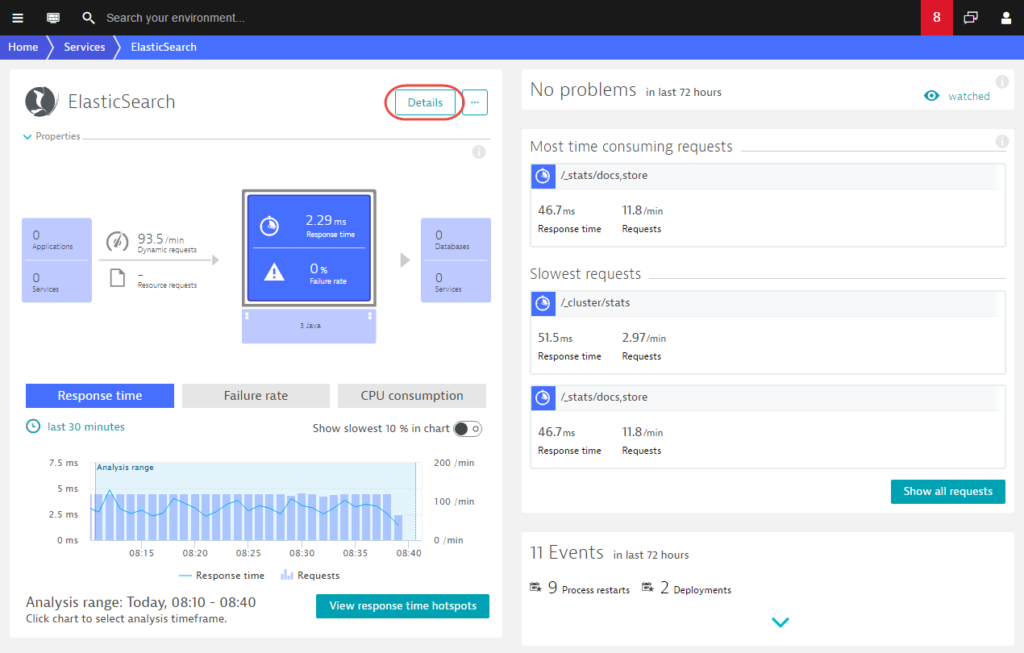
Notice that the service Details page includes a new Service instances section.
The example below shows that three different service instances were detected during the observed timeframe.
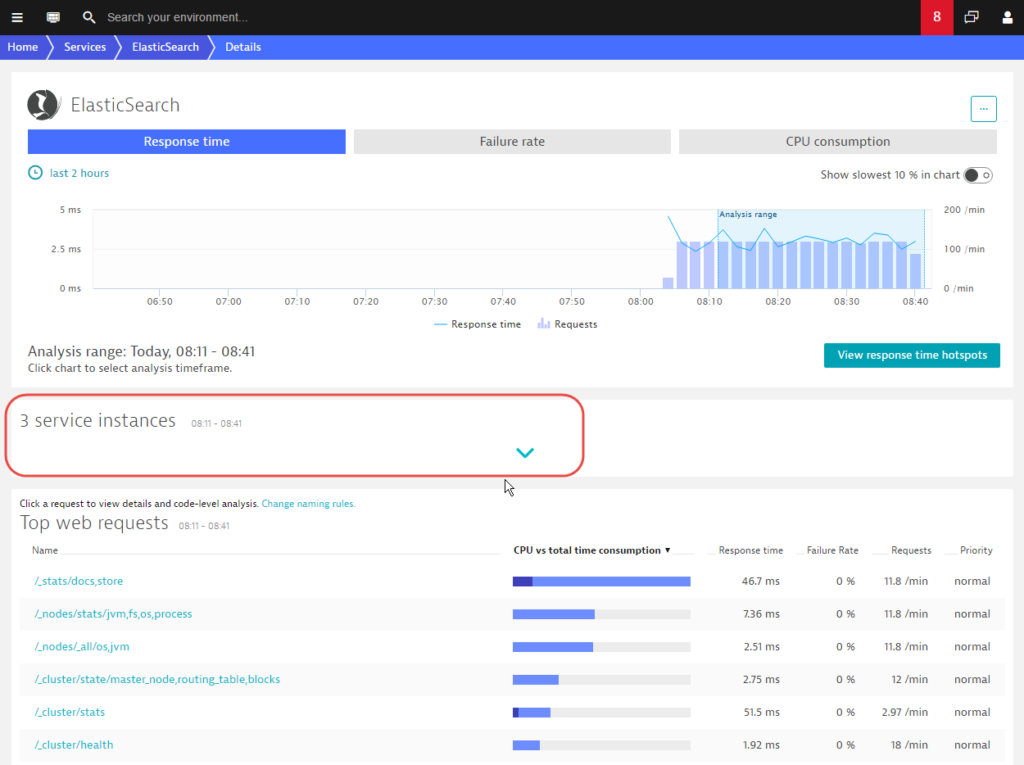
- Expand the Service instances section to view the details.
Analyze service-instance metrics
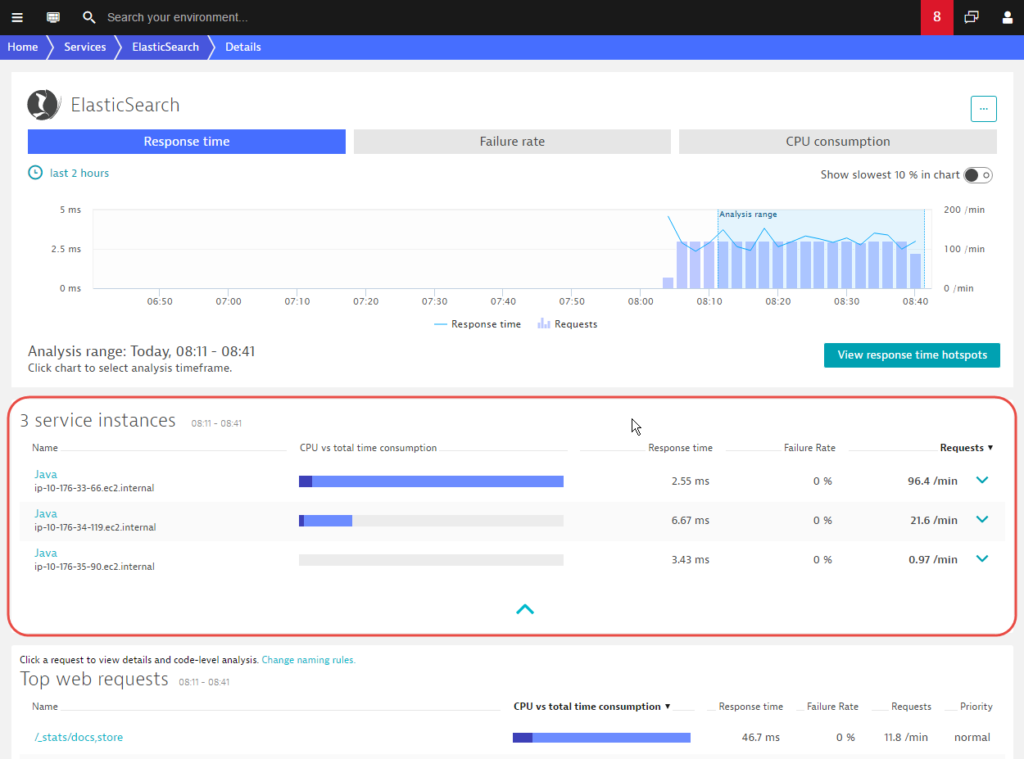
The new Service instances section includes an entry for each service instance that currently exists (or existed during the analysis timeframe). This section is similar to the Top web requests section in that it shows Response time, Failure rate, and load metrics (CPU vs. total time consumption) for each instance detected during the selected Analysis timeframe.
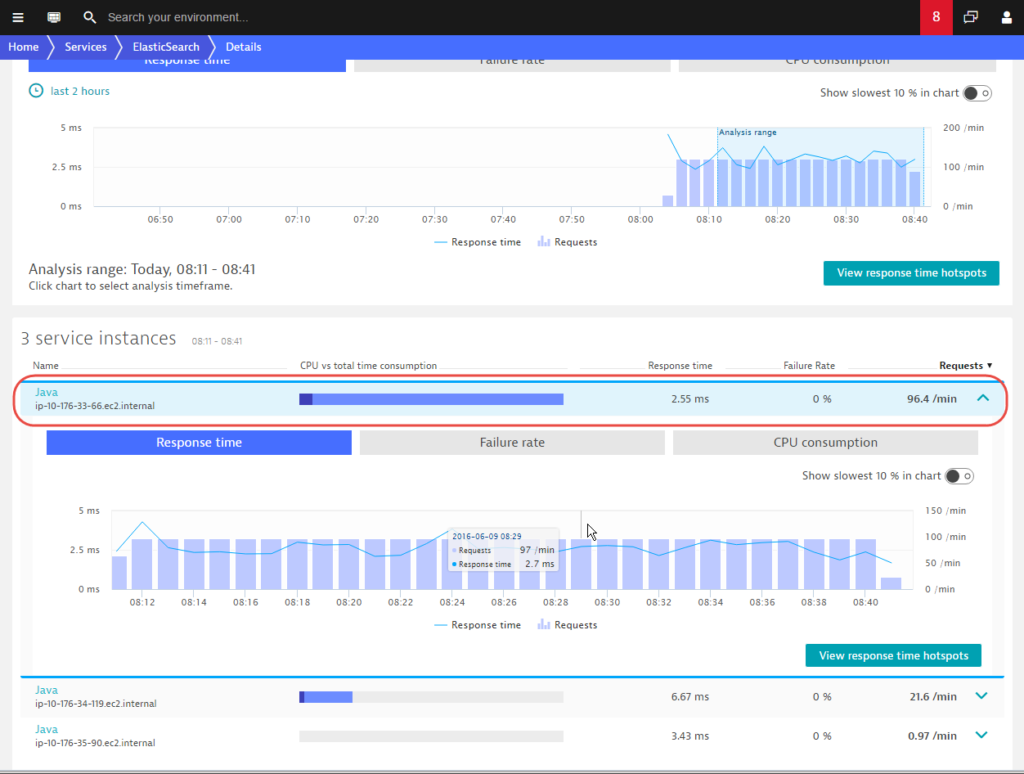
Click an individual service instance to display instance-specific Response time, Failure rate, and load metrics (CPU vs. total time consumption). This enables you to understand if a spike in the overall service response time is occurring on all instances or only a single instance.
In the example below, note that the load isn’t distributed equally across all ElasticSearch cluster nodes. For some reason, the first node processes nearly all requests (96.4 requests per minute)….
…while the third node in the list processes almost no requests (0.97 requests per minute).
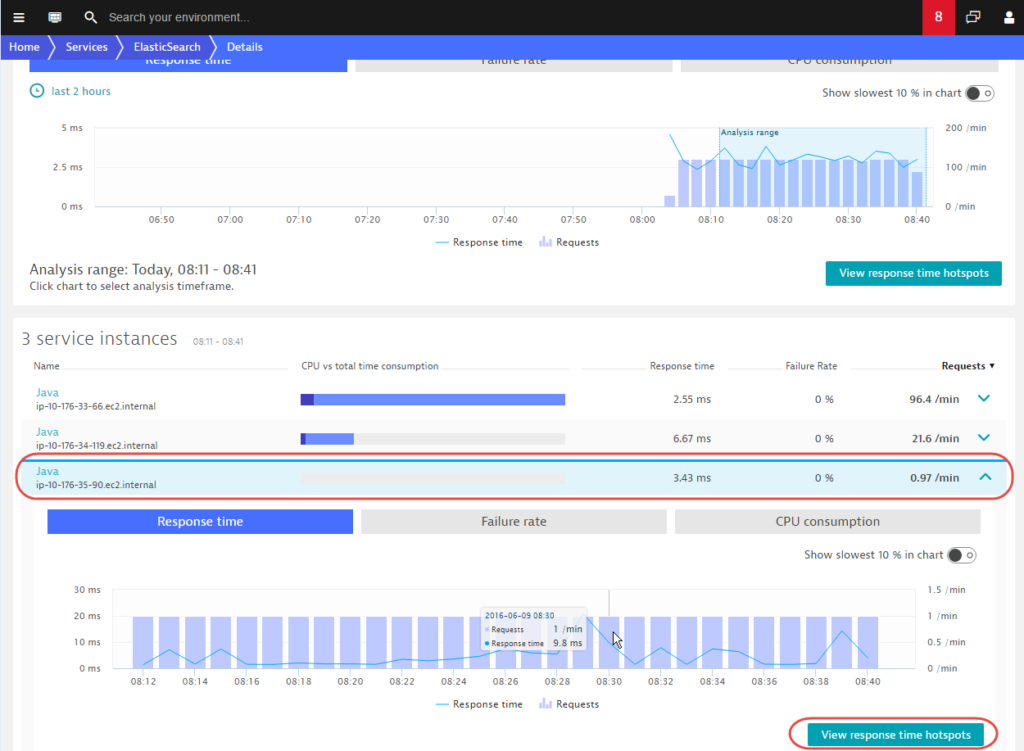
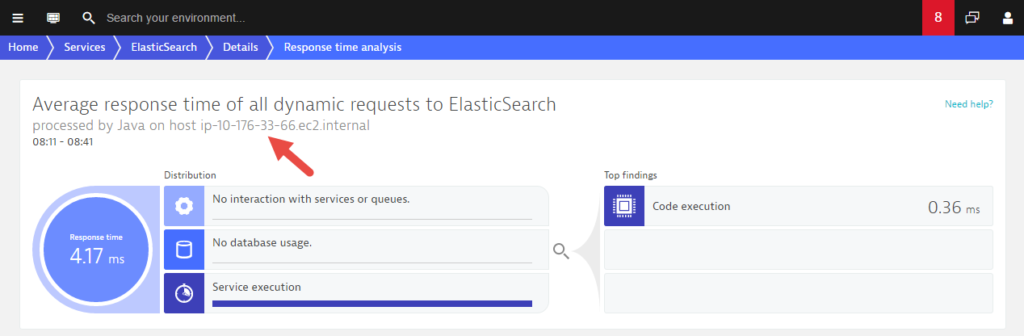
When you encounter such differences in response time between nodes, click Review response time hotspots to analyze the hotspots on each node. The example below shows Response time analysis for a single instance (note the node name for the instance is listed beneath the page title).
You can follow this same approach to analyze Failure rate (number of errors on an instance).
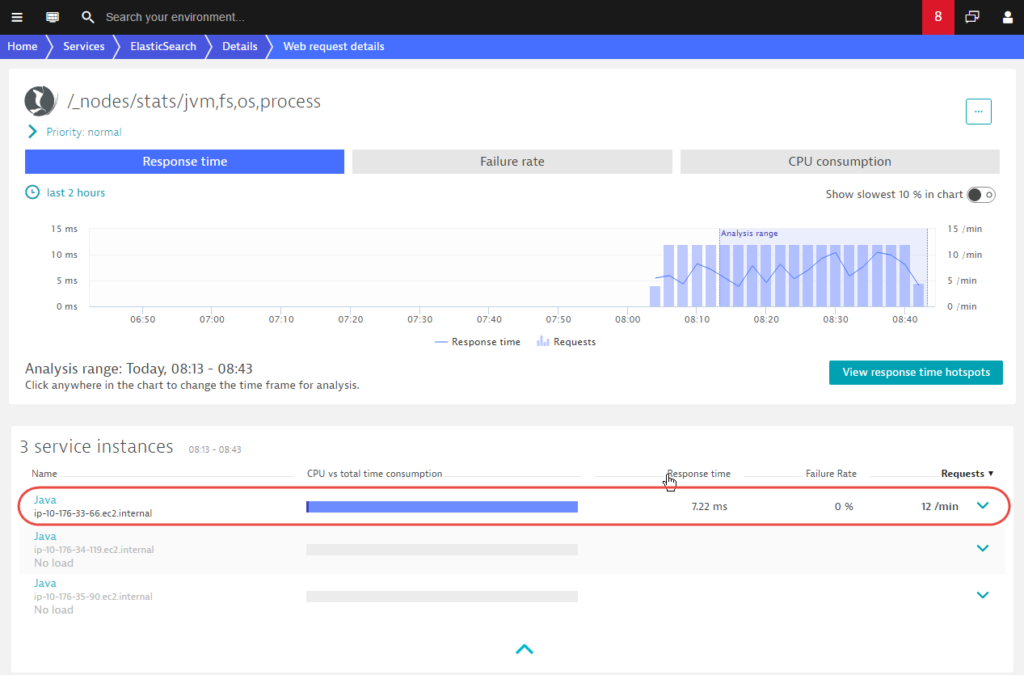
Instance breakdown for requests
You can analyze request types across instances in the same way you analyze services. Instance breakdowns are available for each request type. As you can see on the example Web request details page below, this request was only executed on a single node. The other two nodes aren’t processing this request.
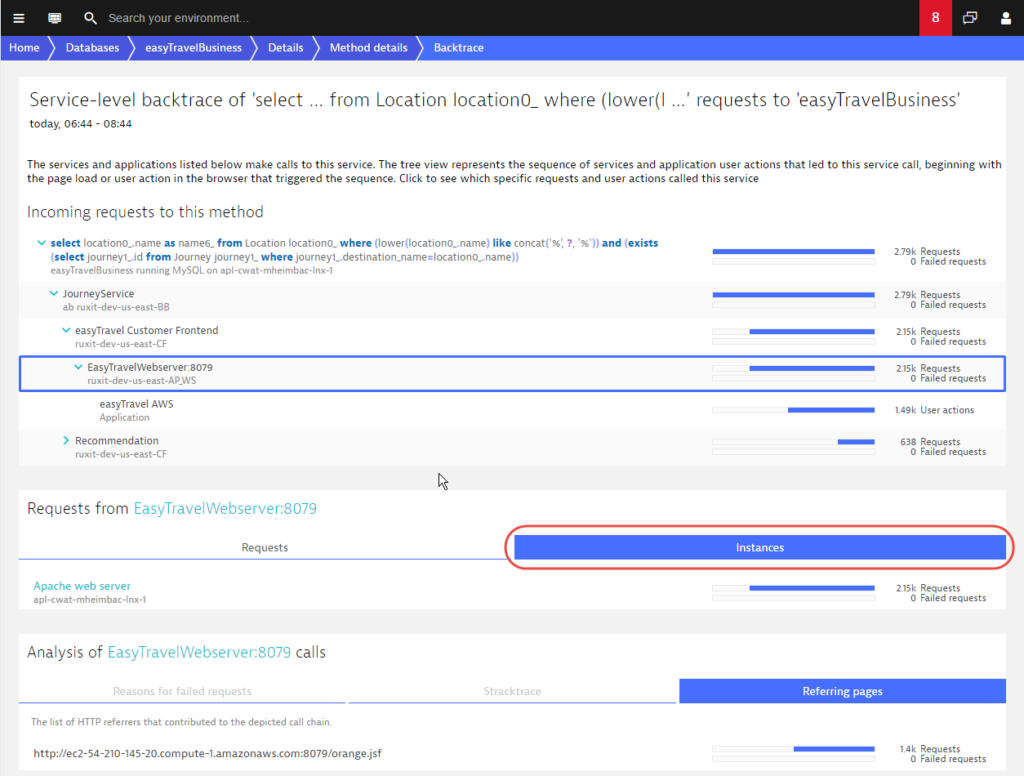
Know which instances make calls to other services
Another interesting bit of insight you get with service-instance analysis is the ability to know from which instance a particular call originates. To achieve this we’ve introduced an instance breakdown to the service Backtrace page. Notice the new Instances tab in the example below. Here you can see not only which service call triggered a particular DB SQL, but also which service instances included the call and how evenly the calls were distributed across instances.


Looking for answers?
Start a new discussion or ask for help in our Q&A forum.
Go to forum